

Most eCommerce stores today run three to four analytics tools simultaneously. Gartner's 2025 Marketing Technology survey found that martech utilisation has dropped to just 49%, meaning roughly half the stack sits unused, even as martech accounts for around 22% of total marketing budgets. Yet with all that tracking in place, the most basic question still goes unanswered every week: which channel is actually profitable?
GA4 shows one revenue number. Platform shows another. Meta claims the sale. So does your email platform. The problem is not that analytics tools are bad, but that most were chosen without a framework. The right eCommerce analytics tools help you turn scattered data into confident, data-driven decisions, so you can optimise performance, allocate budget more effectively, and drive sustainable growth.
That’s why in this guide, we will cover three things: how to tell whether an analytics tool actually supports decisions or just displays data, how to match the right tools to your revenue stage, and the four mistakes that turn analytics investment into sunk cost.
What makes an eCommerce analytics tool actually useful
The market has dozens of analytics tools, all promising polished dashboards and deep insights. But most of them stop at displaying numbers and leave you to figure out what to do next. This distinction matters before you invest because reporting tools and decision-support tools serve different primary purposes.
Buying the wrong type not only wastes budget but also means your team ends up doing the analytical work the tool was supposed to do every single week.
Reporting tools vs. decision-support tools: what’s the difference
-
A reporting tool surfaces numbers: traffic, conversion rate, sessions, and revenue by channel. It gives you accurate data, presented clearly, and then stops. What the numbers mean and what to do about them is left entirely to you.
-
A decision-support tool goes further: It tracks and consolidates data across your store, then identifies where the problem is and points toward the next action, rather than waiting for you to notice something is off.
|
Reporting tool |
Decision-support tool |
|
|
Business purpose |
Tracking ongoing metrics that your team interprets independently |
Detecting problems and opportunities, prioritising their impact and helping your team decide what to do next |
|
Example |
Conversion rate dropped 12% this week |
40% of customers have abandoned at checkout step 3 since Tuesday, likely linked to a shipping fee calculation error |
|
Best for |
Any stage with a team able to analyse data regularly |
Growth stage and above, where a missed error directly costs revenue |
The difference is not in how the dashboard looks, but in what happens after the data is displayed.
A simple test to see if a tool actually drives decisions
Before diving into the eCommerce analytics tools below, run through these four questions for any tool you are currently using or considering. Your answers will make it easier to spot which type you actually need.
-
Does the tool send alerts when something changes, or does it wait for you to log in and look?
-
When something changes in your data, does it surface a probable cause or just the number?
-
Can you tell at a glance which issue to fix first, or do you have to figure out the priority yourself?
-
Has this tool ever prompted your team to act on something you would not have caught otherwise?
If most answers point toward the tool flagging issues and guiding next steps without you having to dig, you are looking at a decision-support tool. If most point toward the tool presenting data for your team to interpret and act on, it is a reporting tool. Neither is wrong; the right choice depends on what your store needs right now, which is exactly what the next section is built to help you figure out.
9 eCommerce analytics tools worth adding to your stack
The tools below are organised by type: decision-support tools that proactively flag issues and suggest actions, followed by reporting tools that surface data for your team to interpret. We'll go through each tool in detail before digging into how to match the right stack to your revenue stage.
|
Tool |
Type |
Function |
Best for |
Pricing |
|
AuditIQ |
Decision-support |
All-in-one eCommerce monitoring: Real-user monitoring, uptime, SEO, security, back-end performance |
Growth-stage stores and above needing real-user monitoring and technical observability in one platform; agencies managing multiple client sites |
From $65/month. Free 14-day trial |
|
Microsoft Clarity |
Decision-support |
Behavioural & Web Analytics: Session recordings, heatmaps, friction signal detection |
Any store wanting visual behaviour data and automatic friction signals without adding to the tool budget |
Free |
|
Lifetimely |
Decision-support |
Profitability & BI: P&L automation, LTV prediction, cohort analysis |
Shopify-native DTC brands ($30K–$300K/month) needing true margin visibility and LTV data |
Free plan for <50 orders/month. Paid from $79/month |
|
Triple Whale |
Decision-support |
Marketing Attribution: Cross-channel attribution, creative analytics, blended ROAS |
DTC brands on Shopify, WooCommerce, or BigCommerce spending $25K+/month on paid ads across multiple channels |
Free Founders Dashboard. Paid plans start from around $549/month |
|
Amplitude |
Decision-support |
Behavioural & Web Analytics: Event-based funnels, retention cohorts, A/B testing |
Larger eCommerce teams with a dedicated analyst needing enterprise-grade behavioural analytics and experimentation |
Free 2M events/month. Paid from $75/month. |
|
GA4 |
Reporting |
Behavioural & Web Analytics: Traffic acquisition, conversion funnels, Google Ads integration |
Every store as a baseline traffic and conversion layer |
Free. GA4 360 from ~$50,000/year |
|
Glew.io |
Reporting |
Profitability & BI: Multi-channel BI, inventory analytics, product-level profitability |
Multi-channel merchants needing unified BI across platforms, marketplaces, inventory, and shipping data |
Custom pricing plans |
|
Mixpanel |
Reporting |
Behavioural & Web Analytics: Event tracking, funnel analysis, user flow visualisation |
Stores with complex purchase journeys or subscription models; requires a developer |
1M monthly events free, $0.28 per 1K events after |
|
Northbeam |
Reporting |
Marketing Attribution: Multi-touch attribution, media mix modelling, incrementality testing |
Brands spending $250K+/month on paid media needing attribution depth beyond pixel-based tools |
From $1,500/month |
AuditIQ
Type: Decision-support
Function: All-in-one eCommerce monitoring
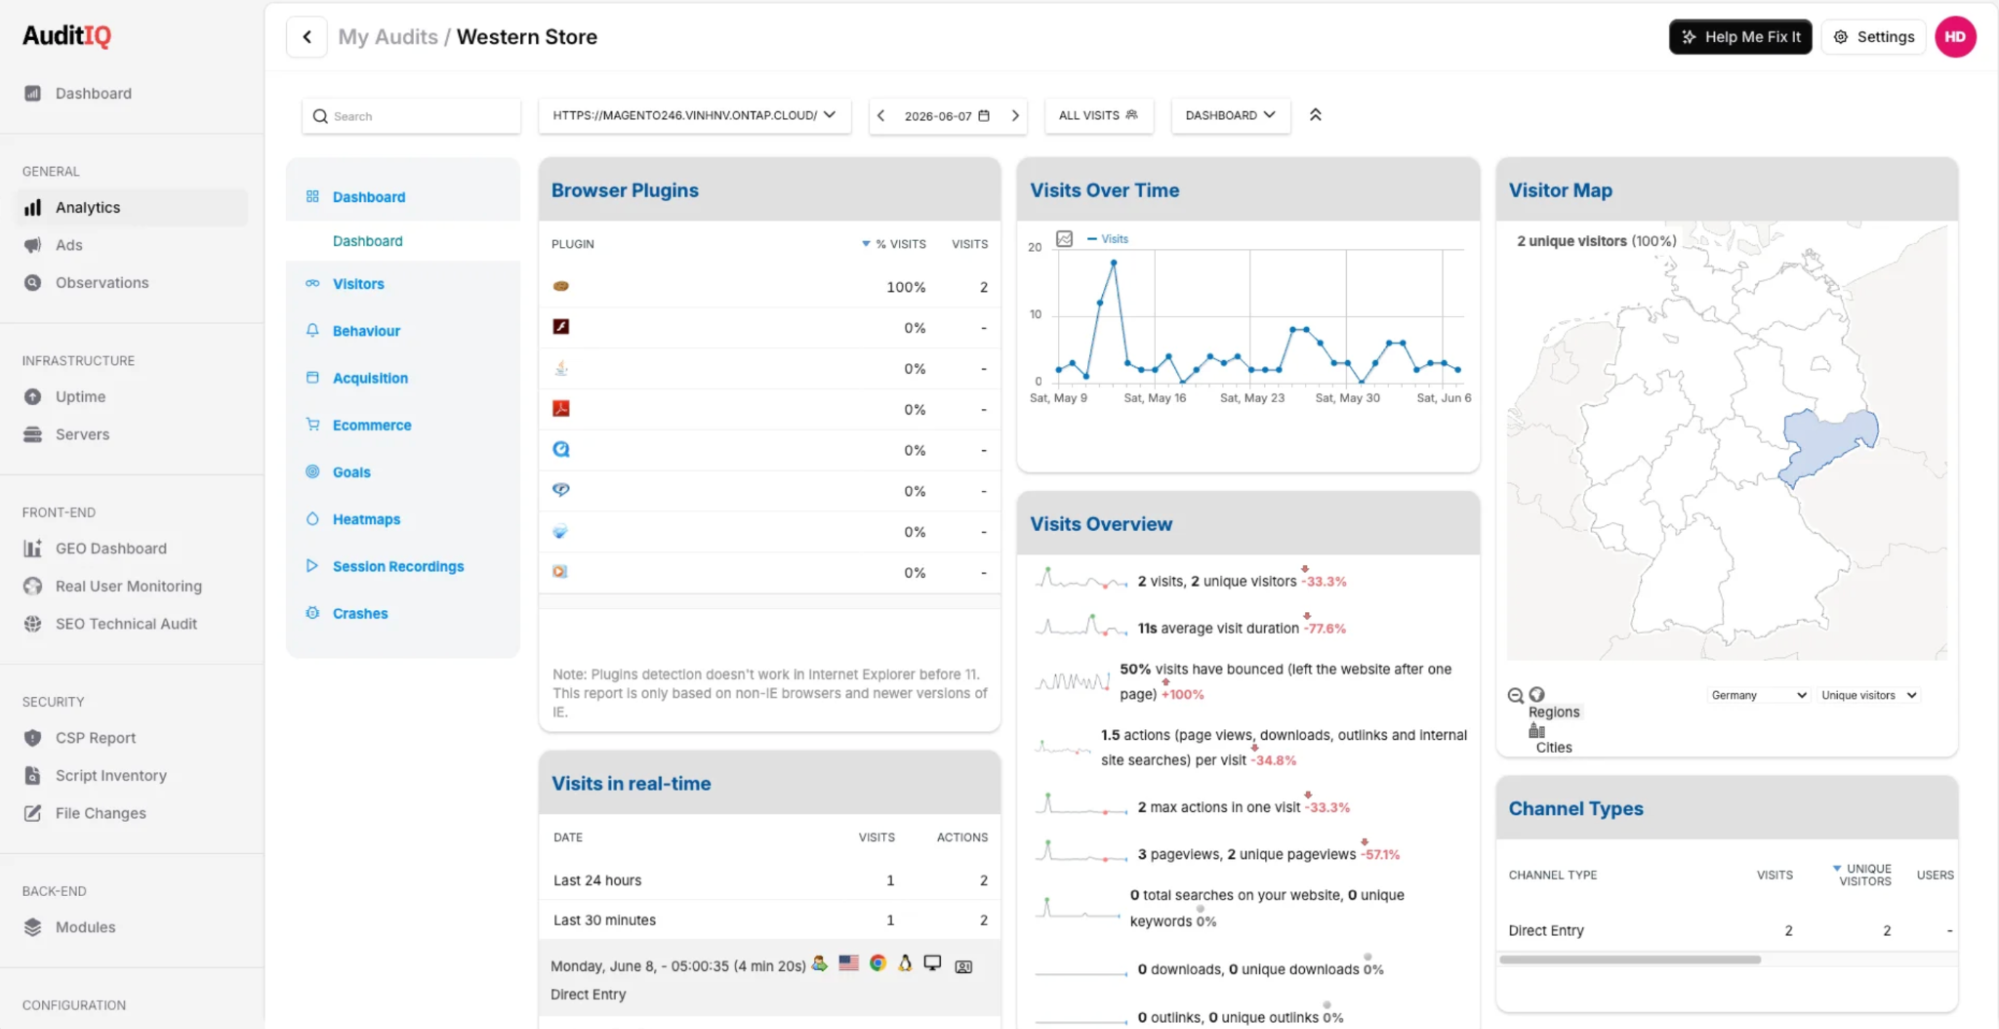
AuditIQ eCommerce monitoring tracks real-time visitor activity, session behaviour, traffic acquisition, front-end errors, and page-level performance across your store. It proactively monitors continuously rather than waiting for you to log in, flags issues as they occur with a probable cause alongside each alert, and prioritises findings by revenue impact so your team always knows what to fix first. Notifications go out via email, Slack, or Teams before customers notice and before the issue has time to affect your data.
Beyond real-user monitoring, AuditIQ extends into uptime, server health, Core Web Vitals, technical SEO, security signals, back-end configuration, and AI search visibility across ChatGPT, Google AI Overviews, and Perplexity, all in one connected platform built specifically for eCommerce.
Highlight features:
-
Real-time website analytics including visitor tracking, sessions, users, page views, landing pages, traffic acquisition, conversions, session recordings, and front-end error monitoring, updated as frequently as every 5 minutes
-
24/7 uptime, server health, SSL, and Core Web Vitals monitoring across front-end and back-end
-
Security monitoring including Magecart detection, file integrity tracking, CSP violations, and PCI-DSS compliance checks
-
Technical SEO audits, plus backlink tracking and competitor benchmarking
-
AI search visibility monitoring across ChatGPT, Google AI Overviews, and Perplexity
-
GA4 and Google Ads integration to connect traffic and spend data alongside audit findings in one view
Pricing: From $65. Free 14-day trial available.
Best for: Growth-stage stores and above where an undetected checkout bug, security issue, or server problem can cost revenue within hours. Also fits agencies that manage multiple client storefronts from a single dashboard.
|
Is your analytics data telling you the full story? AuditIQ monitors your store's real-user metrics, tracking accuracy, SEO health, and backend errors continuously, so data gaps and revenue leaks get flagged before they distort every report above them. |
Microsoft Clarity
Type: Decision-supporting
Function: Behavioural & Web Analytics
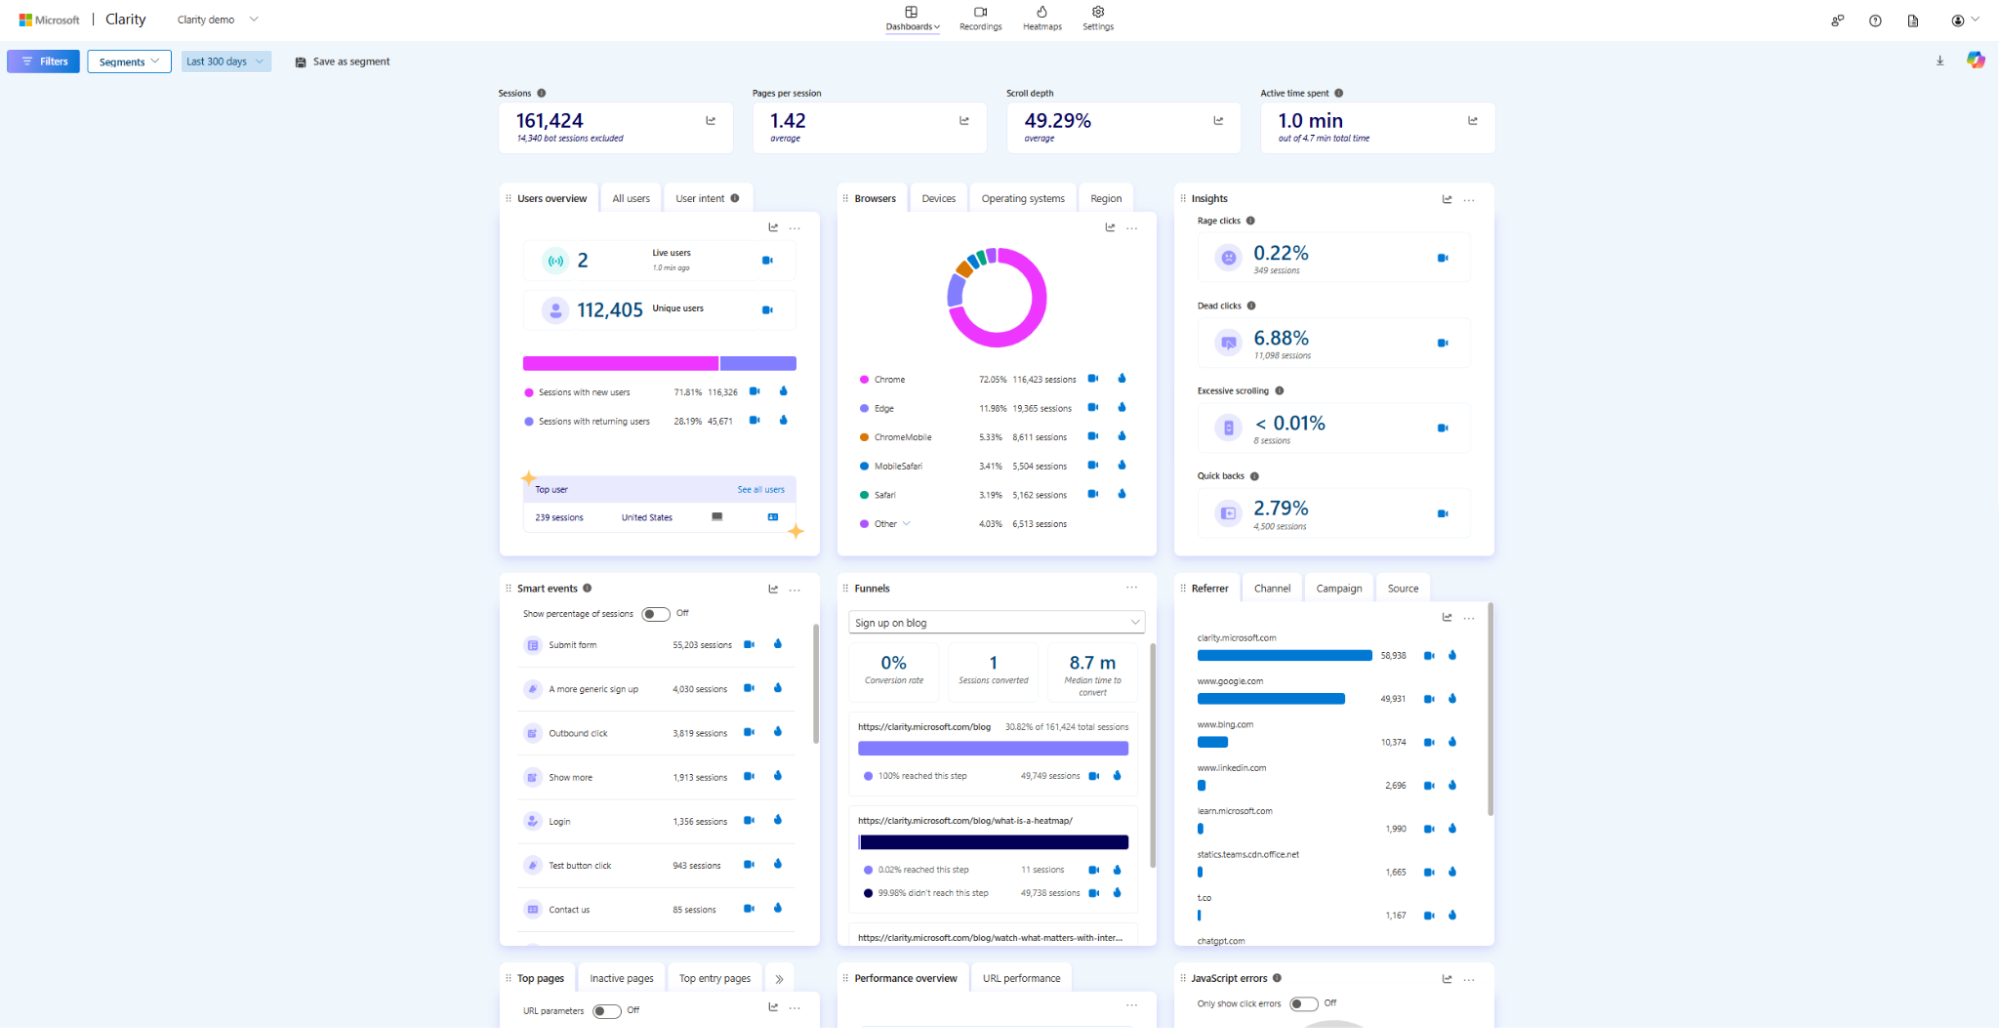
Clarity does one thing well: it shows you what users are actually doing on your site. Session recordings let you watch real visitor journeys, and heatmaps show where people click and how far they scroll. Rage clicks, dead clicks, and scroll depth anomalies are flagged automatically without you having to look for them, which is what puts Clarity closer to decision support than pure reporting.
All of this is free, with no session recording caps, no trial period, and no paid tier to unlock the useful features.
However, the practical limits are straightforward. Clarity does not track revenue or cart events natively, has no funnel visualisation built in, and does not offer on-site surveys if qualitative feedback matters to your team. Session recordings are retained for 30 days.
Highlight features:
-
Unlimited session recordings with no traffic caps
-
Click maps, scroll maps, and heatmaps across all pages, including checkout
-
Rage click and dead click detection are flagged automatically
-
AI-generated session summaries via Copilot
-
Native GA4 integration and dedicated Shopify app
Pricing: Free. No paid tier exists.
Best for: Any store at any stage that wants visual behaviour data without adding to the tool budget. Most useful when paired with GA4 rather than used as a standalone analytics solution.
Lifetimely
Type: Decision-support
Function: Profitability & BI
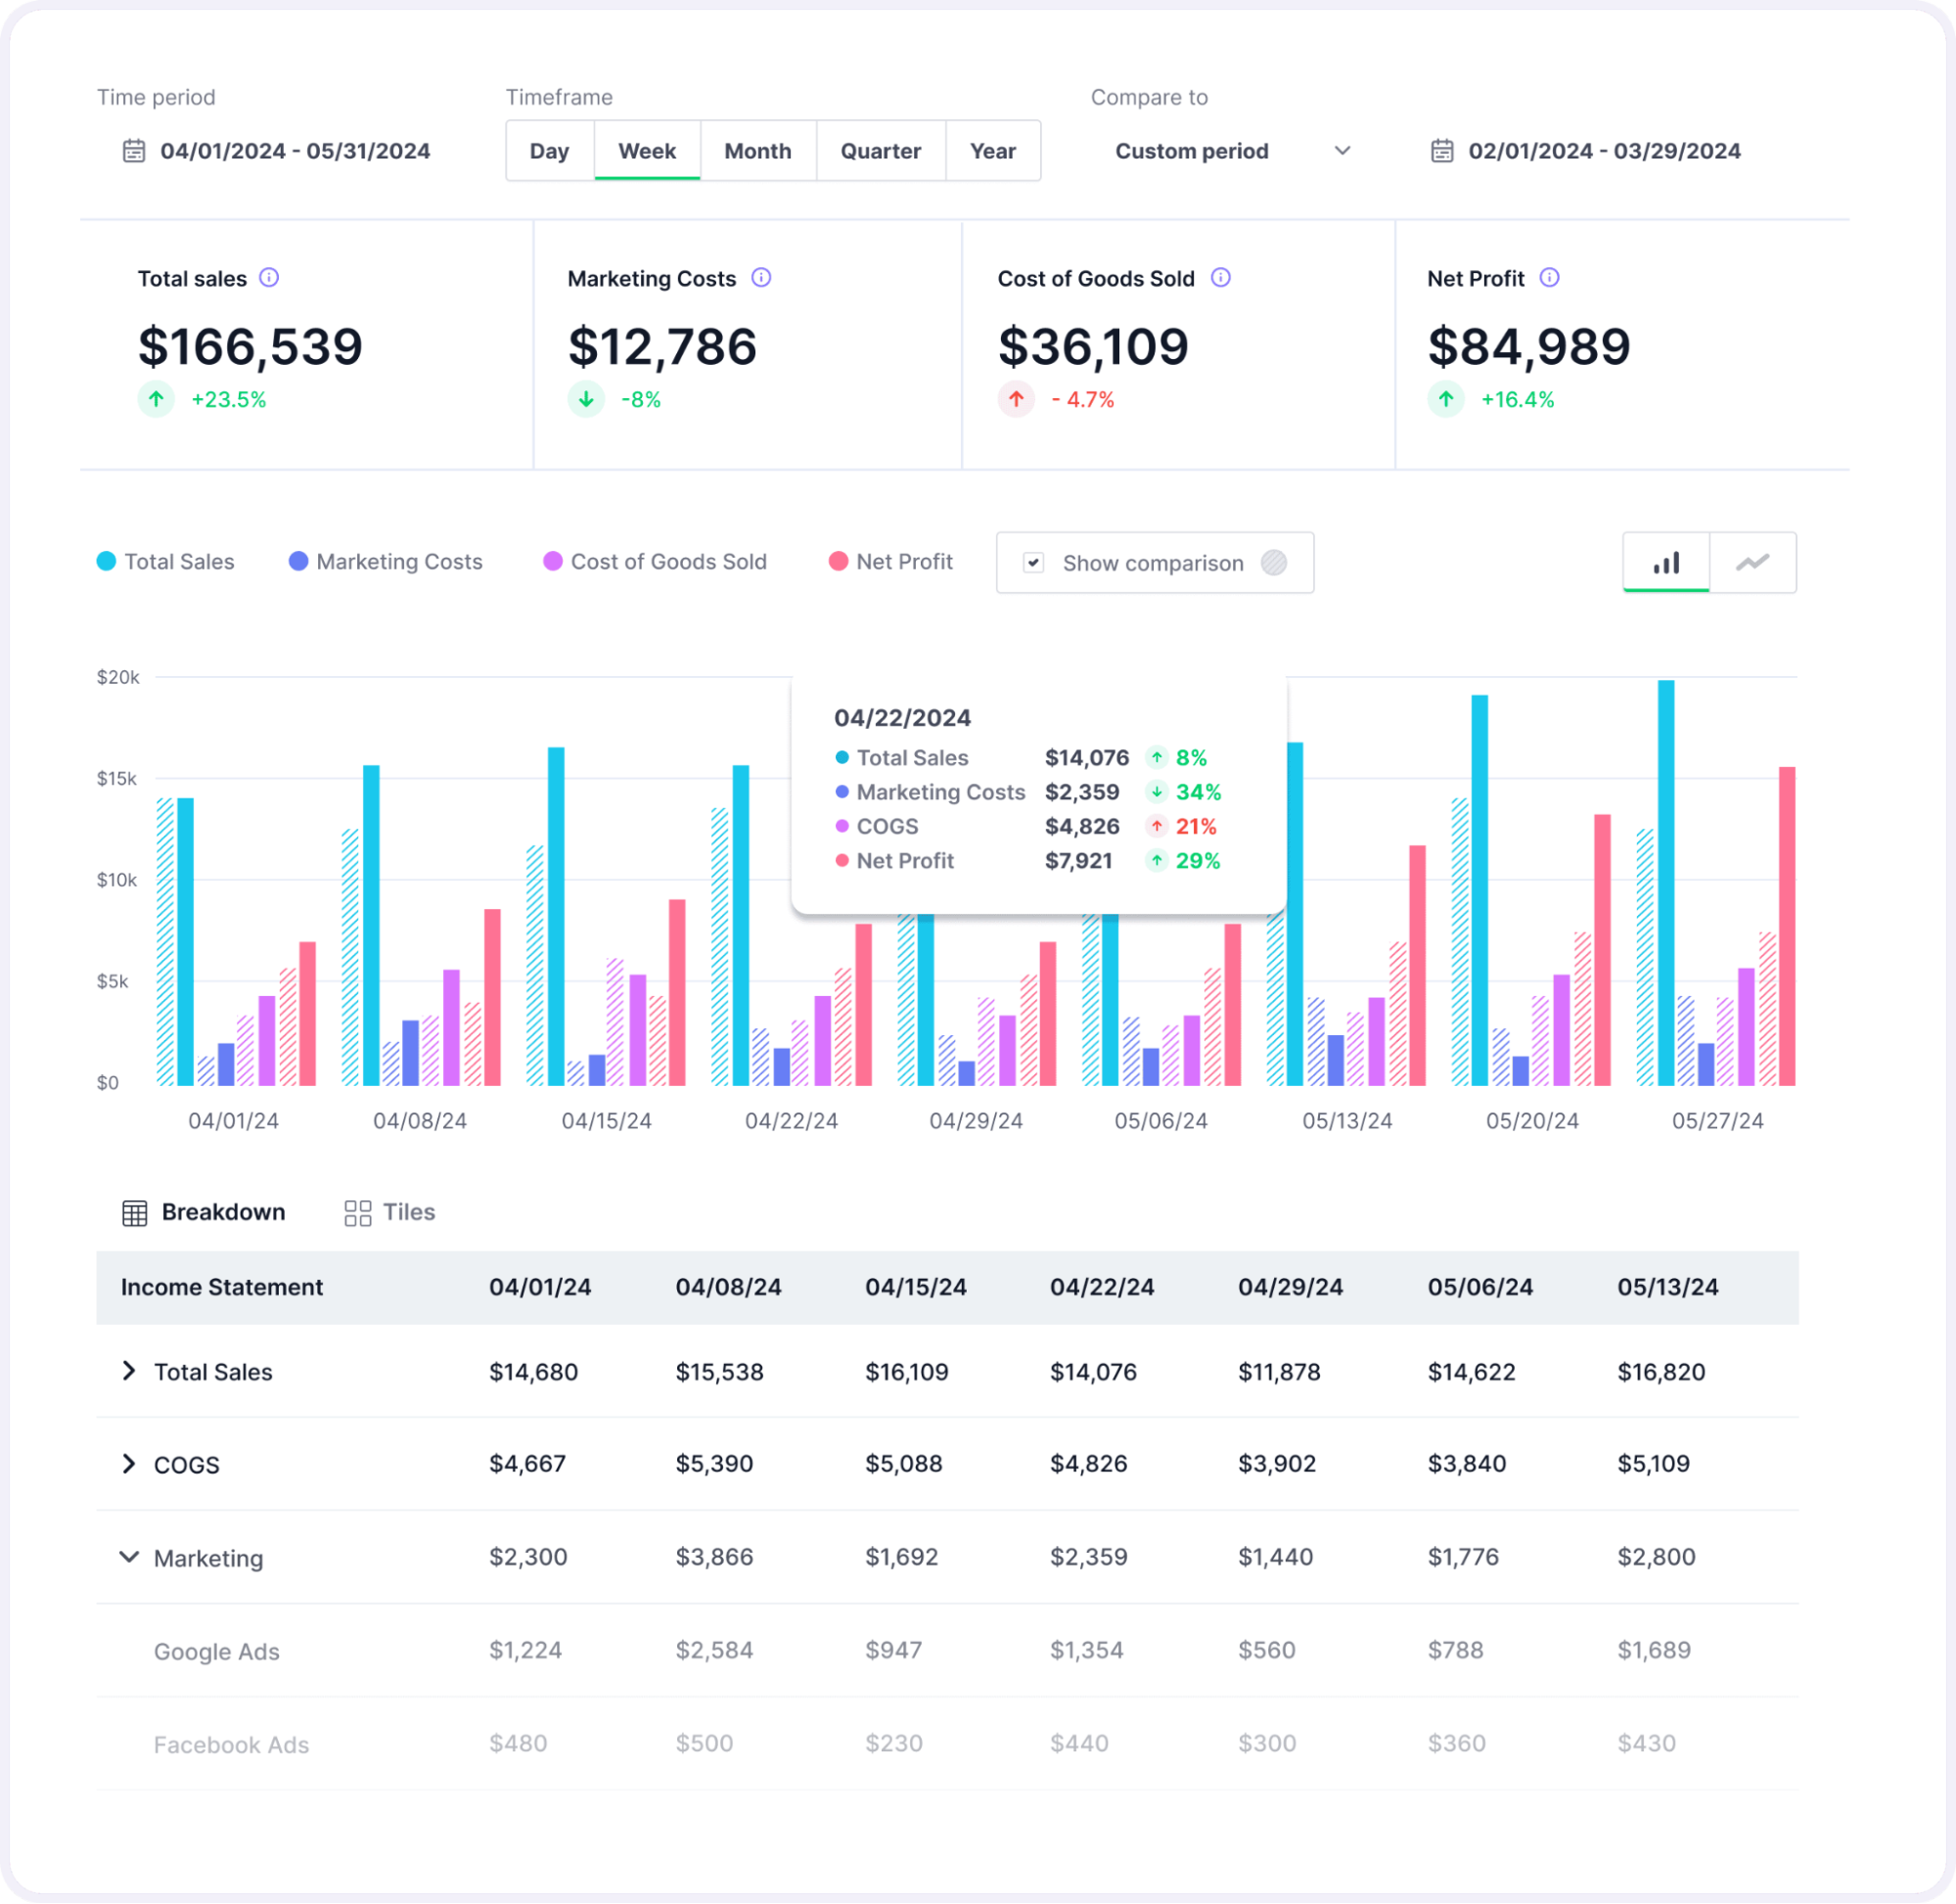
Where most Shopify analytics tools stop at revenue, Lifetimely starts at profit. It pulls in COGS, shipping costs, transaction fees, and ad spend to calculate what is actually left after costs, and delivers that as a daily P&L rather than a monthly spreadsheet exercise. The other thing it does well is cohort analysis: grouping customers by acquisition date, channel, first product, or geography, then tracking what each group is actually worth over time. For stores where retention and repeat purchase rate drive the business model, that visibility changes how acquisition budgets get set.
Highlight features:
-
Daily automated P&L connecting Shopify revenue, ad spend, COGS, shipping, and transaction fees into one net profit view
-
Cohort analysis by acquisition date, channel, first product, geography, and discount code, with LTV, repeat purchase rate, and CAC payback per cohort
-
Predictive LTV model trained across $100B+ GMV from 45,000+ stores, with month-to-month customer value forecasts
-
Channel-level ROAS and CAC tracking with first- and last-touch attribution across Meta, Google, TikTok, and more
-
AI Profit Agent that flags anomalies and recommends next actions
Pricing: Free plan available for stores with under 50 orders per month. Paid plans start at $79/month.
Best for: Shopify-native DTC brands doing roughly $30K to $300K in monthly revenue that need real CAC payback data and a daily P&L without building a data warehouse.
Triple Whale
Type: Decision-support
Function: Marketing Attribution
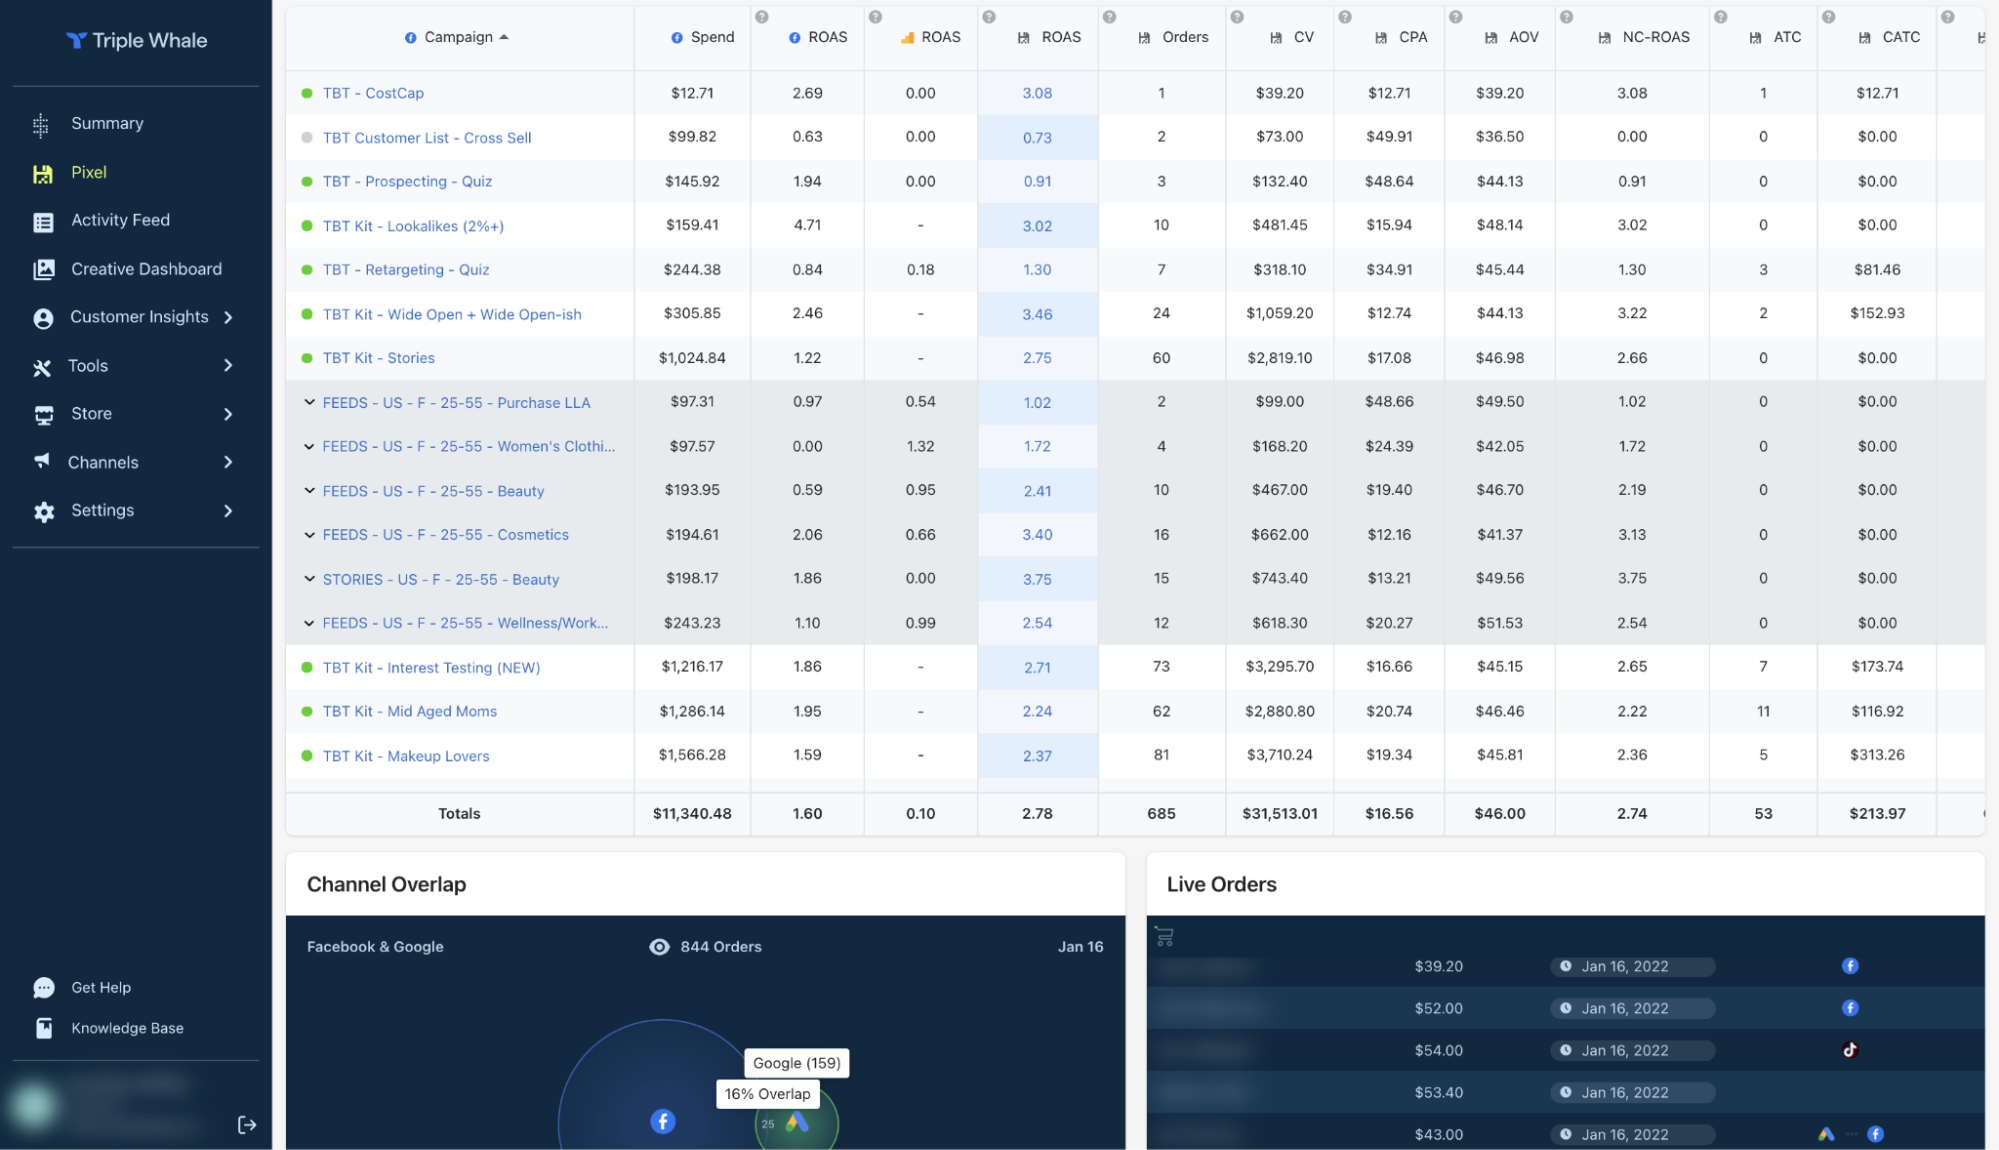
Triple Whale is built around one core problem: ad platforms report their own performance, and they consistently overclaim it. Triple Whale installs its own first-party pixel on your store to give you an independent view of which channel actually drove the conversion.
Beyond attribution, it pulls store data, ad spend, and customer metrics into one dashboard with an AI layer on top. Ask it why ROAS dropped last Tuesday, and it cross-references ad spend, refund rate, and shipping costs rather than leaving you to diagnose it manually.
The honest caveats: the pixel only tracks behaviour from installation onward, relies on correct UTM setup, and takes more care to configure than the onboarding implies. Pricing also scales with GMV, so your bill grows as your store grows.
Highlight features:
-
First-party pixel for attribution independent of ad platform reporting
-
Unified dashboard across Shopify, Meta, Google, TikTok, email, and SMS
-
Creative analytics linking ad formats and hooks to actual conversion performance
-
Moby AI assistant for querying data and surfacing anomalies proactively
Pricing: Free Founders Dashboard available. Paid plans start from around $549/month; scales by GMV. Contact Triple Whale for detailed pricing.
Best for: DTC brands on Shopify, WooCommerce, or BigCommerce spending $25K or more per month on paid ads across multiple channels who need attribution data independent of what ad platforms report.
Amplitude
Type: Decision-support
Function: Behavioural & Web Analytics
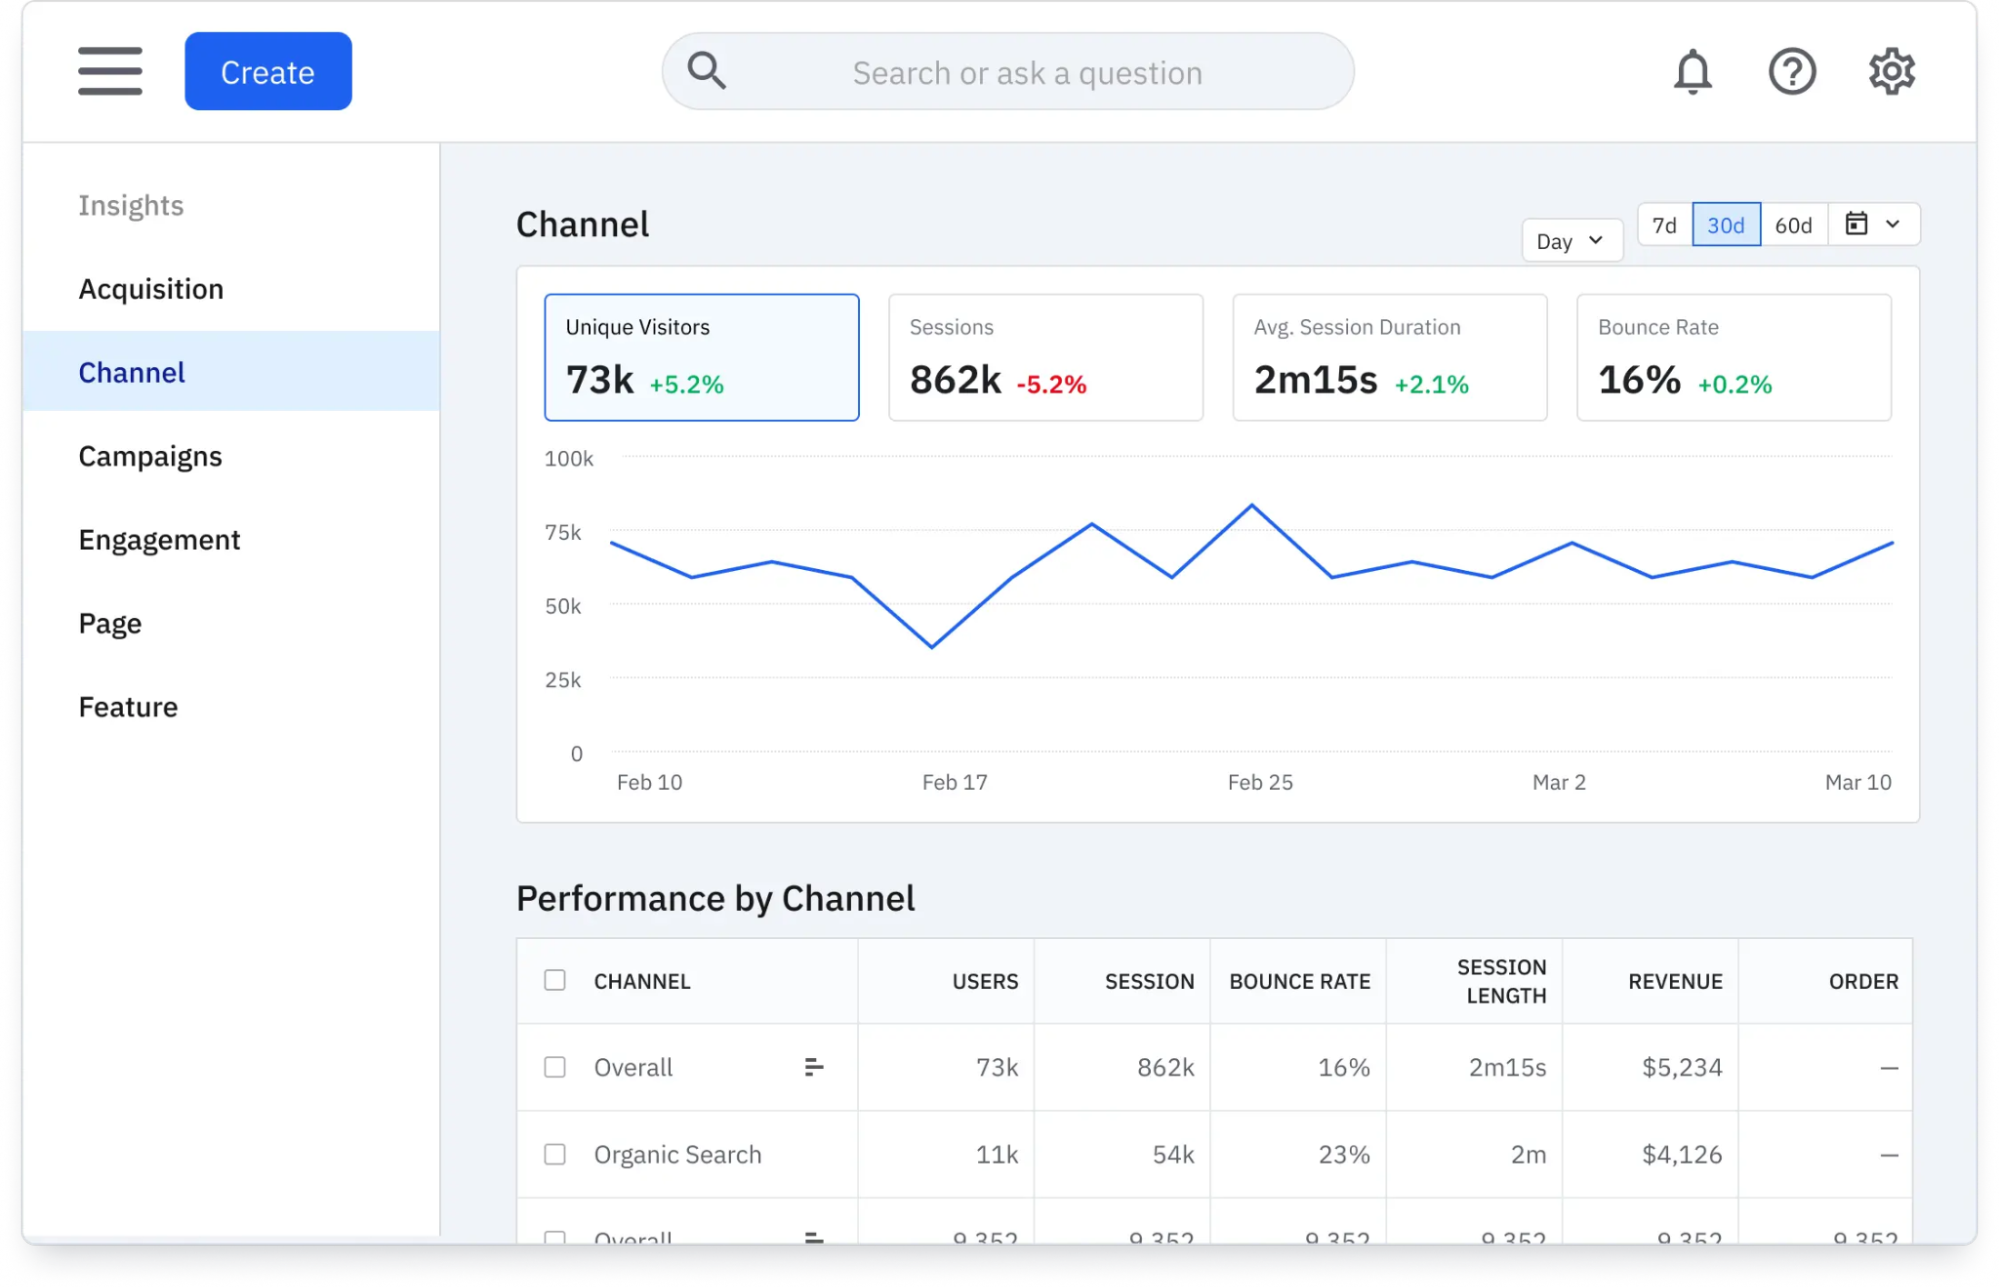
Amplitude is built on event-based tracking with a depth of behavioural analysis. Its ML-powered predictive cohorts, anomaly detection, and AI agents proactively surface patterns and flag issues before your team notices them manually.
Funnel reports, retention cohorts, A/B testing and feature flagging are all bundled into the same platform, so teams running experiments do not need a separate tool. It requires a developer and a clean event instrumentation plan upfront. The learning curve is steeper than most, and pricing scales with monthly tracked users in a way that can climb significantly at the growth stage.
Highlight features:
-
Behavioural cohort analysis and predictive cohorts using ML to forecast user behaviour
-
Built-in A/B testing and feature flagging with experiment results tied directly to analytics
-
Session replay linked to funnel drop-off for immediate qualitative context
-
AI-powered natural language querying and anomaly detection
-
Composable CDP with identity resolution and audience activation for external channels
Pricing: Free 2M events/month forever. Plus plan starts from $75/month for 3M events. Growth and Enterprise pricing is custom.
Best for: Larger eCommerce teams with a dedicated analyst or data function that need enterprise-grade behavioural analytics, experimentation, and audience activation in one platform.
GA4
Type: Reporting
Function: Behavioural & Web Analytics
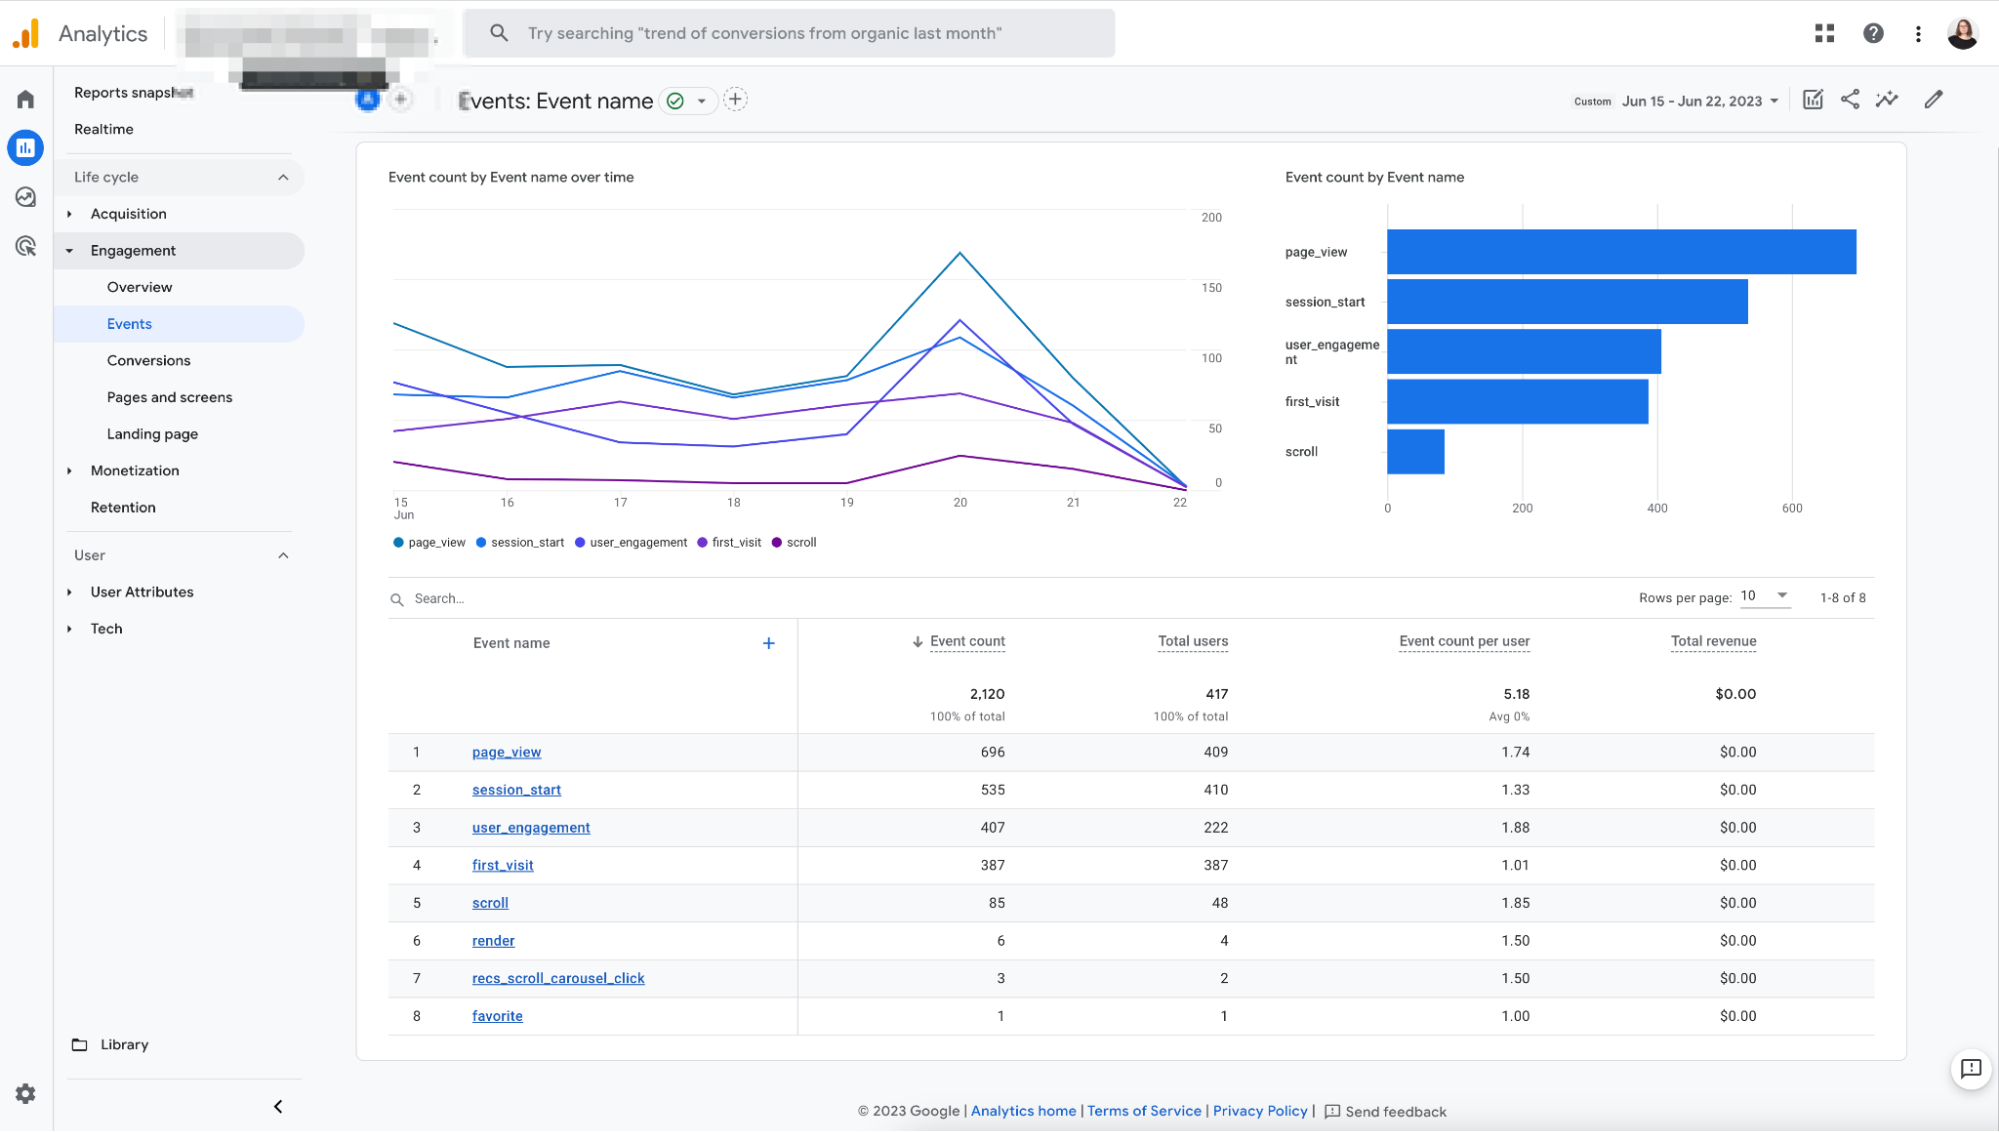
GA4 is the starting point for almost every eCommerce analytics stack, and for early-stage stores, it is often enough on its own. It tracks traffic sources, sessions, conversion funnels, and on-site behaviour, connects natively to Google Ads, and costs nothing.
In 2026, Google added an AI-powered Insights panel that flags weekly anomalies automatically and independent conversion attribution settings per conversion event that reduce the common mismatch between GA4 and Google Ads reporting. Useful additions, though GA4 remains primarily a reporting tool: it surfaces what happened, not why.
Highlight features:
-
Traffic acquisition, session, and conversion funnel reporting across web and app
-
Native Google Ads integration for cross-channel campaign reporting
-
AI Insights panel that surfaces weekly anomalies automatically
-
BigQuery export for custom reporting on higher-volume stores
-
Free, with all core features included on every property
Pricing: Free. GA4 360 (enterprise) starts at approximately $50,000/year.
Best for: Every store, regardless of stage, as a baseline traffic and conversion layer, particularly those just starting to build an analytics stack.
Glew.io
Type: Reporting
Function: Profitability & BI
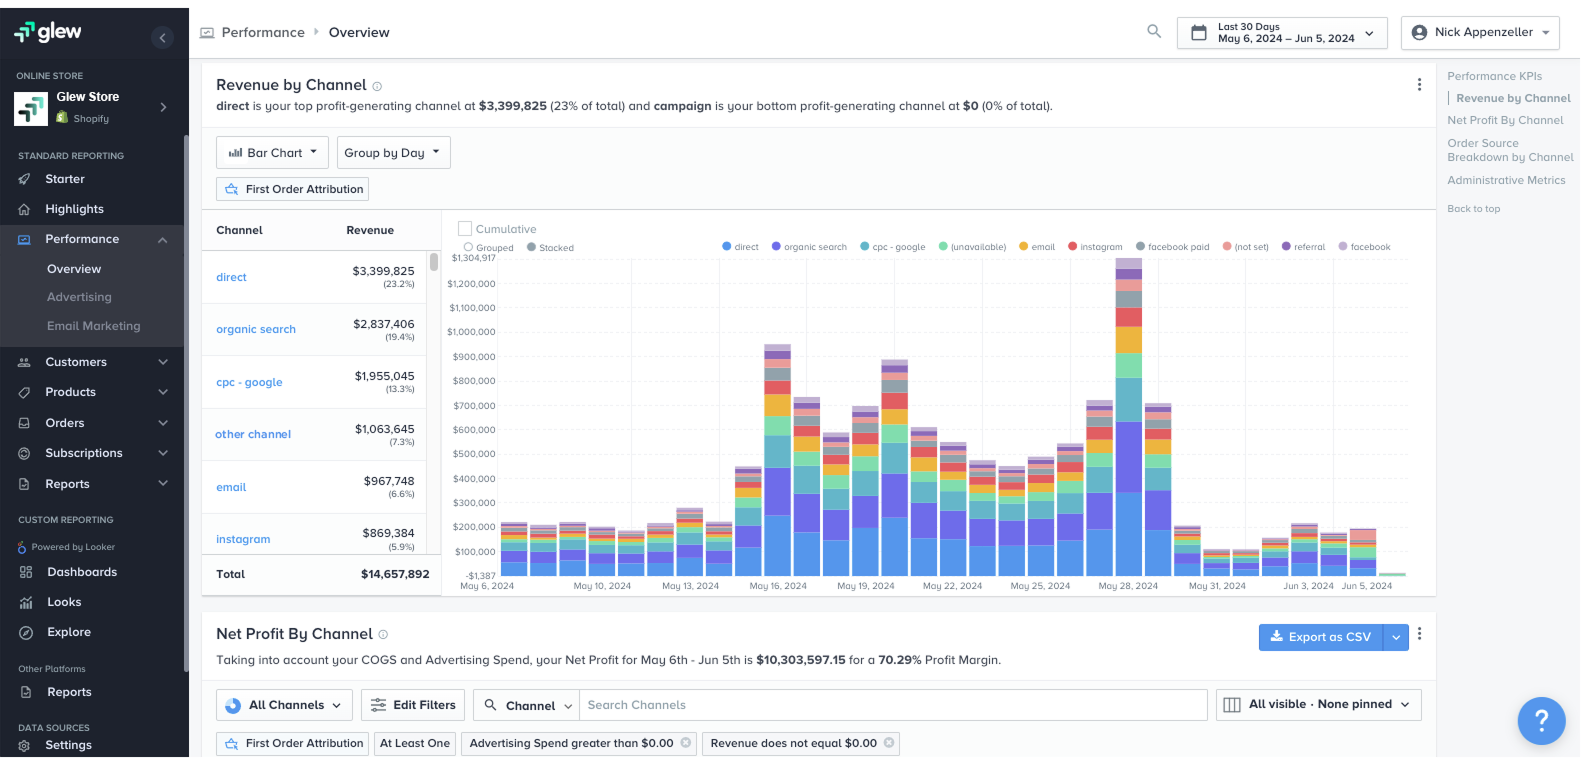
Glew sits in the BI layer of an eCommerce analytics stack. Where Lifetimely focuses on LTV and unit economics for Shopify, Glew is built for merchants who need a single view across multiple channels, platforms, and data sources, including Shopify, WooCommerce, Magento, BigCommerce, Amazon, marketplaces, ad platforms, inventory systems, and shipping providers.
The core value is consolidation. Glew centralises the data and lets you slice it by product, channel, customer segment, or any combination. Product-level profitability, inventory sell-through, and margin by channel are its strongest use cases. The more SKUs and channels a store has, the more useful it becomes. For stores with a single channel and a small product range, the depth may exceed what the team can actually use.
Highlight features:
-
170+ integrations across eCommerce platforms, marketplaces, ad channels, inventory, shipping, and ERP systems
-
Product and inventory analytics, including sell-through rates, COGS tracking, and reorder signals
-
Customer segmentation with automated sync to Klaviyo and Listrak
-
Multi-channel revenue and margin reporting across Amazon, eBay, Walmart, TikTok Shop, and more
-
Scheduled and automated reports delivered to your team
Pricing: Pricing varies; details are provided after a demo. Free trial is available.
Best for: Stores that need both behaviour analytics and qualitative user feedback in one platform, particularly teams running active CRO programmes where knowing what users do and why they do it both matter.
Mixpanel
Type: Reporting
Function: Behavioural & Web Analytics
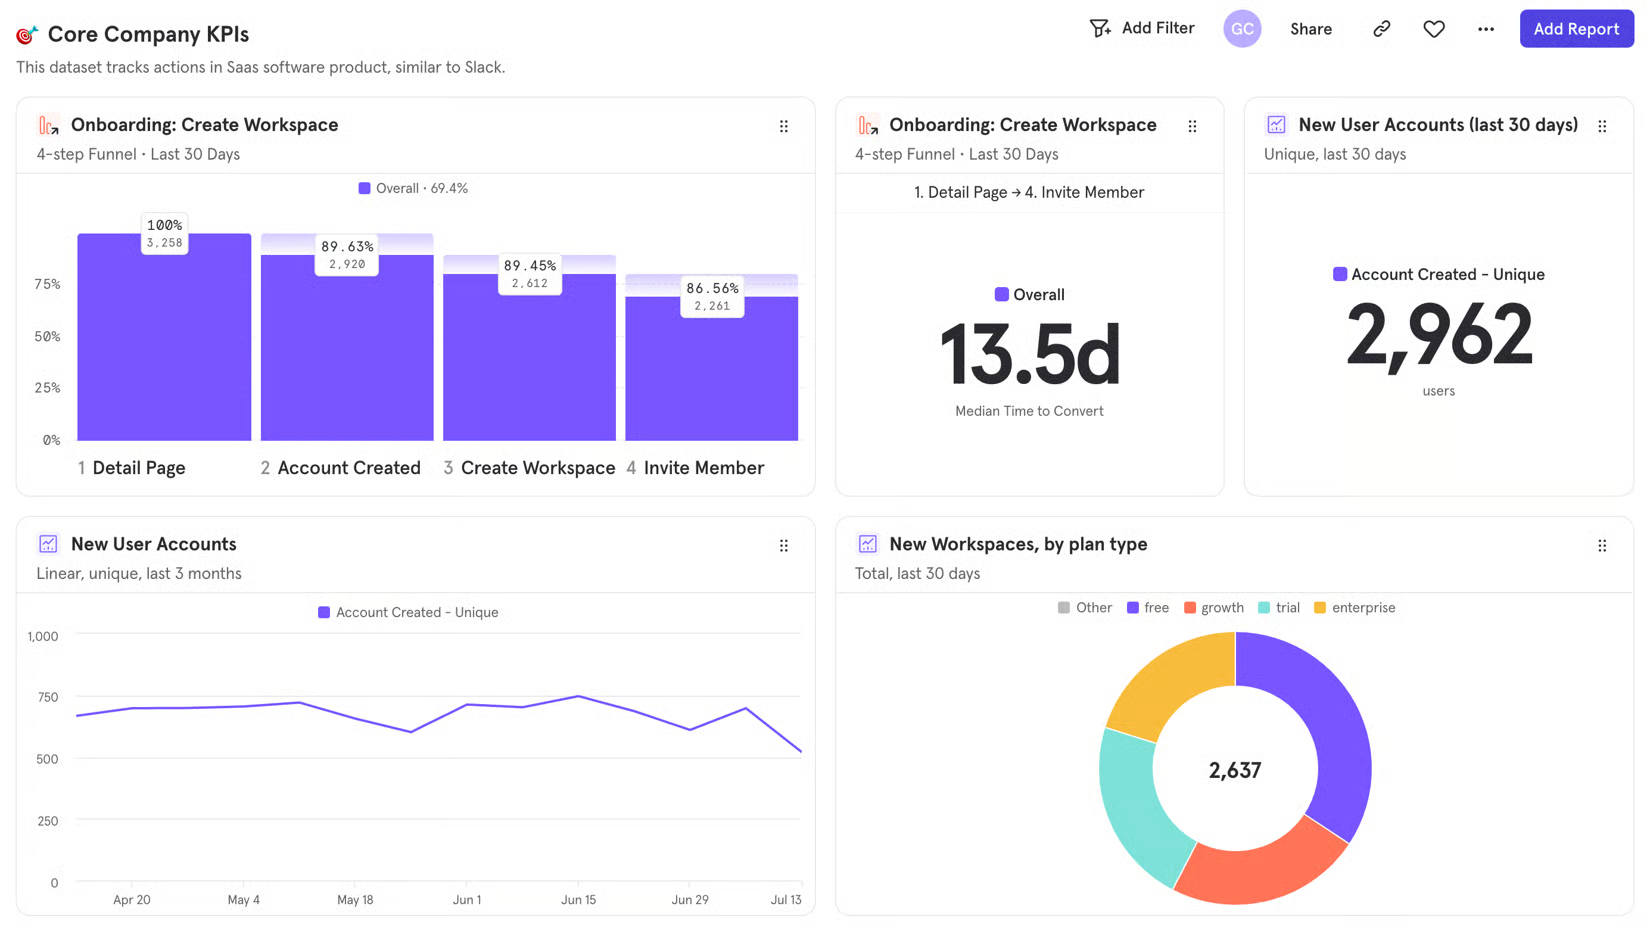
Mixpanel is built around event-based tracking: instead of counting pageviews, it captures specific user actions such as add to cart, checkout started, coupon applied, and purchase completed, then lets you analyse patterns across those events with funnel reports, retention cohorts, and user flow visualisations. That granularity makes it particularly suited to stores with complex purchase journeys or subscription models where understanding what happens between the first visit and repeat purchase actually changes decisions.
The platform requires a developer to instrument events correctly upfront. Teams that invest in a clean event schema get fast, flexible reporting; teams that skip this step get unreliable data in a clean-looking dashboard. Pricing scales by event volume rather than by seat, generous at lower volumes but worth modelling before committing at scale.
Highlight features:
-
Event-based funnel analysis tracking specific user actions across the full purchase journey
-
Retention and cohort reports showing which customer segments return and why
-
Session replay tied directly to funnel drop-off points for immediate context
-
Spark AI query builder for natural-language data questions without SQL
-
Warehouse connectors for Snowflake, BigQuery, and Databricks on Enterprise
Pricing: 1M monthly events free, and $0.28 per 1K events after (volume discounts available)
Best for: Stores with complex, multi-step purchase journeys or subscription models where understanding granular user behaviour between sessions drives product and retention decisions.
Northbeam
Type: Reporting
Function: Marketing Attribution
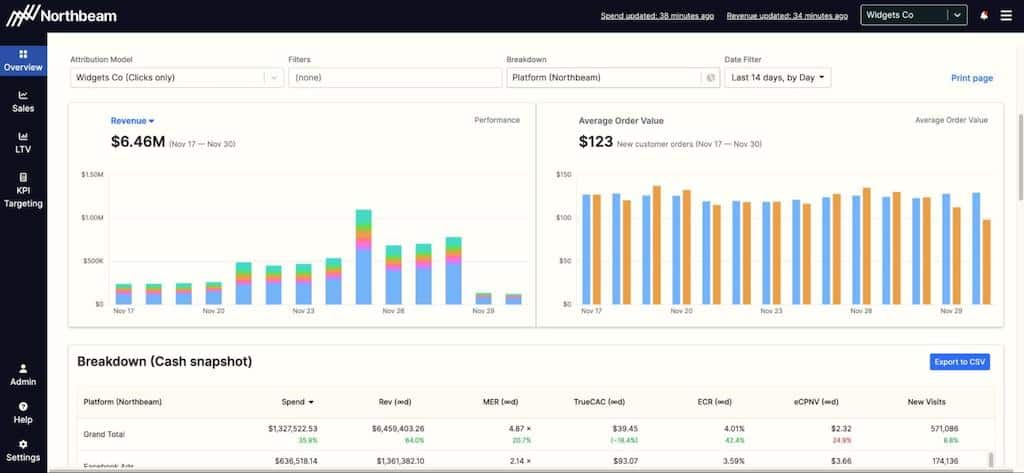
Northbeam gives you a more granular view of how budget is distributed across the customer journey than most attribution tools can provide. Its multi-touch attribution model, media mix modelling, and incrementality testing are built for teams that want to interrogate their own assumptions about channel performance rather than accept platform-reported ROAS at face value. The data is there; the interpretation and the action remain with your team.
The trade-offs are real. No free trial. Setup requires a calibration period before data becomes reliable. The cost starts from $1,500 per month; the ROI case is difficult to make for smaller stores.
Highlight features:
-
Multi-touch attribution across Meta, Google, TikTok, Snap, Pinterest, and CTV with unlimited lookback windows
-
MMM+ for budget scenario modelling and channel forecasting
-
Apex integration layer that sends first-party signals back to ad platforms to improve their own algorithms
-
Creative analytics at the individual ad level (Professional plan and above)
Pricing: Starts at $1,500/month. Professional and Enterprise are custom.
Best for: Brands spending $250K or more per month on paid media across multiple channels that need attribution depth beyond what pixel-based tools can provide.
The right eCommerce analytics tools for every revenue stage
Adding more tools does not automatically mean better decisions. At the wrong stage, a sophisticated attribution platform sits unused because the data volume is not there yet to make the model meaningful. At a later stage, staying on free tools too long means making margin and channel decisions without the visibility to make them well.
The right stack depends on where your store is now, not on what the most advanced brands are running.
1. Free-tier starter stack for new stores (under $10K/month)
At this stage, the priority is getting clean, reliable baseline data, not coverage across every analytics layer. Three tools are enough:
-
GA4 for traffic sources, sessions, and conversion funnel data
-
Your native platform analytics (Magento, Shopify, WooCommerce, etc.) for order and revenue data directly from the platform
-
Microsoft Clarity for session recordings and friction signals on key pages
No paid tool is justified yet. The more important investment at this stage is setting these three up correctly: clean UTM tagging, accurate conversion events in GA4, and Clarity installed across checkout. Bad data from a free tool will cause more damage later than a missing paid feature will now.
2. When to upgrade to advanced attribution tools ($10K–$100K+/month)
The signal to add paid tools is not a revenue threshold. It is when the free-tier stack can no longer answer the questions the business needs to act on. Watch for these:
-
The team spends hours each week manually reconciling numbers across platforms
-
Ad budget decisions are made without reliable channel-level margin data
-
ROAS looks healthy in the ads platform, but does not show up in actual profit
-
Nobody can answer which product or channel is genuinely profitable without pulling data from multiple platforms manually
-
A checkout bug or site error goes unnoticed for days before someone spots the revenue drop
When two or more of these are true simultaneously, the stack needs to expand. The typical sequence at this stage: add a technical monitoring layer first (AuditIQ) to ensure the data feeding every other tool is accurate, then an attribution tool (Triple Whale) to resolve the cross-platform number mismatch, then a profitability layer (Lifetimely) once clean attribution data is in place.
At $100K+/month, a full stack across all four function layers becomes a revenue protection decision. The cost of a missed error, a misattributed channel, or an undetected margin leak at this volume consistently exceeds the cost of the tools preventing it.
Common mistakes to avoid when choosing eCommerce analytics tools
Many teams blame their analytics tools when the real problem lies elsewhere. Most apparent tool failures are actually caused by reporting delays, operational processes or poorly configured data pipelines. Four patterns come up consistently:
-
Analytics data doesn't match across platforms. Some discrepancy between GA4, Shopify, and your ad platforms is normal. Significant mismatch almost always points to a fixable technical issue: a broken tracking script, missing UTM tags, duplicate events after a theme update, or a pixel that stopped firing after a site change. Before concluding the tool is wrong, check the data layer underneath it first.
-
Upgrading too early or too late. Too early means paying for attribution modelling before you have the traffic volume and ad spend for it to be meaningful. Too late means making margin and channel decisions on incomplete data for months longer than necessary. The trigger to upgrade should be a specific question your current stack cannot answer, not a revenue milestone.
-
Relying on tools instead of process. A dashboard nobody reviews on a fixed cadence is overhead, not insight. The tool surfaces the data; someone still needs to look at it, ask the right question, and act on the answer. Define the three to five questions your team must be able to answer every week, and make sure the stack exists to answer those, not to generate new ones.
-
Failing to combine attribution, behaviour, and margin data. Looking at only one layer and treating it as the full picture is the most expensive blind spot. A channel can show excellent ROAS in the attribution report while the products selling through it carry margins too thin to justify the spend. No single tool covers all three layers, which is exactly why the stack exists.
|
Cart abandonment rates have held at around 70% for over a decade, and the causes are rarely obvious: broken customer journeys, UX friction, and hidden errors can surface at any point without your team noticing until the revenue impact shows up in a report. AuditIQ monitors your store 24/7 and provides real-time data across visitor activity, session behaviour, traffic acquisition, front-end errors, and performance signals, so you can prioritise what actually needs fixing before it costs you more sales. Get a free demo and check your store's health today. |
Wrap up
The right eCommerce analytics stack is not the most expensive or the most comprehensive one. It is the one that answers the questions your business actually needs to act on, at your current stage, without requiring your team to spend half their week reconciling numbers manually.
Start with clean foundations. Add tools when specific questions go unanswered, not when a new platform looks impressive. And before trusting any number your analytics stack surfaces, make sure the data feeding it is accurate.
If you need help choosing, integrating, or migrating to the right tools for your business stage, get in touch with our On Tap team to discuss how we can help.