

When it comes to eCommerce performance, speed isn’t just a technical detail — it’s a critical business factor. A slow-loading Magento store can frustrate users, damage your SEO rankings, and lead to lost revenue. Research by Portent found that each additional second of load time between 0 and 5 seconds can drop conversion rates by an average of 4.42% per second.
Improving Magento site speed starts with knowing how to test it properly, which tools to use, and how to act on the results. This guide will help you:
-
Prepare for effective speed testing – understand lab vs. field tests, Core Web Vitals, and how to structure tests across devices, networks, and representative page types
-
Compare the top 10 Magento speed tools – including Google PageSpeed Insights, GTmetrix, WebPageTest, and more
-
Monitor performance continuously – using tools like AuditIQ to detect regressions and reduce manual testing
-
Improve Magento loading speed – with proven tactics like theme optimisation, caching, image compression, and JS/CSS clean-up.
Whether you're troubleshooting performance issues or building a long-term optimisation strategy, this guide will help you choose the right tools for your Magento store — and use them more effectively.
Pre-test checklist: What you need to know before a Magento speed test
Testing the speed of your Magento site involves more than simply using an online tool. To get meaningful results, you need to understand the context behind each metric, how to structure your testing approach, and how to account for real-world conditions. Here’s what to prepare before you begin.
Understand the key metrics: Core Web Vitals and beyond
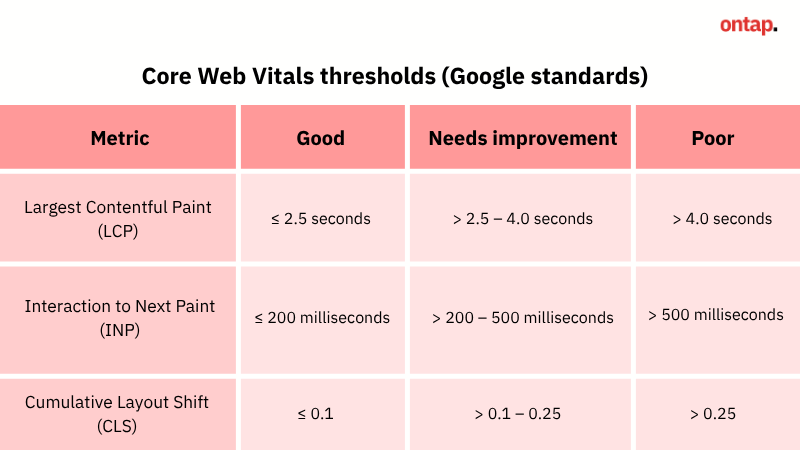
Core Web Vitals are the gold standard for evaluating real-world performance. They measure how users experience your site — not just how quickly it loads, but how smoothly it behaves during interaction.
-
Largest Contentful Paint (LCP)
- What it measures: Measures the time it takes for the largest visible element (usually above the fold) to fully render in the browser.
- Example: A customer visits your homepage. The main banner with a sale promotion is the largest element on the screen. LCP measures how long it takes from the moment they request the page until that banner is completely rendered and visible.
-
Interaction to Next Paint (INP)
-
What it measures: The time between when a user interacts with your site (e.g., clicks or taps) and when the next visual response appears on screen.
-
Example: On a category page, a user clicks the “filter by colour” checkbox. INP measures the time from that click until the product grid visibly updates (e.g., fades or repaints).
-
-
Cumulative Layout Shift (CLS)
-
What it measures: The total movement of content on the screen as new elements load — especially shifts that happen without user input.
-
Example: A user scrolls down a product page. As product images and reviews load asynchronously, the “Add to Cart” button suddenly shifts down the page. CLS adds up all these layout jumps to determine how unstable the page layout is during load.
-
These aren’t just technical scores — they correlate directly with user satisfaction, bounce rates, and SEO rankings. If you improve your Core Web Vitals, you improve the overall experience.
To interpret these metrics correctly, it’s helpful to know what Google considers a “good” result — and where the thresholds lie for performance that needs improvement or is considered poor. The table below summarises Google’s official scoring standards:
Other key performance metrics
While Core Web Vitals are essential, a full Magento speed test should also include:
-
First Contentful Paint (FCP) – When the first visible element appears (target: <1.8s).
-
Speed Index (SI) – How quickly visible parts of the page populate (target: <3.4s).
-
Time to Interactive (TTI) – When the page is fully usable (target: <5s).
-
Total Blocking Time (TBT) – Time the browser is “stuck” due to long-running scripts (target: <200ms).
-
Time to First Byte (TTFB) – How quickly the server responds after a request is made. High TTFB often signals backend or hosting-related delays.
These give you a more nuanced picture of what’s slowing your store down — whether it’s scripts, styles, server latency, or rendering inefficiencies.
Understand the two types of speed test: Lab vs. Field
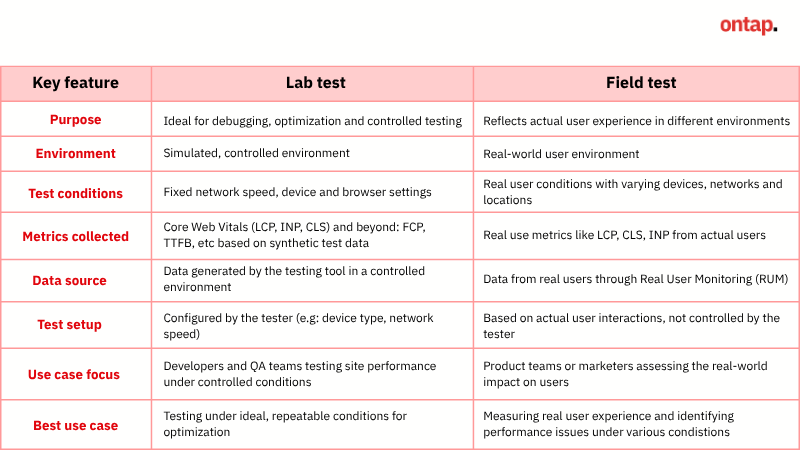
Not all speed tests are created equal. To get an accurate picture of your Magento store’s performance, it’s important to understand the difference between lab tests and field tests — and why you need both.
Lab tests
Lab tests simulate how your site loads under controlled conditions — typically using a desktop browser, average connection speed, and no user history or background processes.
Because these tests are run in the same way each time, they’re useful for comparing performance before and after changes. However, they don’t show how your site performs for actual users, especially on mobile or slower networks.
Field tests
Field tests collect data from real people visiting your site, using their own devices, browsers, and internet connections. This includes users on mobile, older phones, slow 4G, or overseas networks.
The data is captured directly in the browser (such as Google Chrome) and reflects real usage patterns — including how long pages take to load, how quickly buttons respond, or whether layout elements shift unexpectedly. This is the data Google uses in its Chrome UX Report and Core Web Vitals scoring.
Summary:
-
Use lab tests to spot technical problems in a consistent, testable way
-
Use field tests to understand how your site performs for actual customers
Best practice: Use both types of testing. Lab tests help diagnose technical issues, while field data confirms whether your improvements make a real impact for users.
Always test the mobile experience
Desktop and mobile users don’t experience your Magento store in the same way — and performance issues often appear only on one or the other. Mobile testing is especially important, given that the majority of eCommerce traffic now comes from smartphones.
There are three key reasons to test specifically for mobile:
-
User behaviour differs by device: Mobile users often browse quickly or on the move, while desktop users expect more detailed interaction. Each group has different expectations for speed and responsiveness.
-
Mobile bottlenecks are more common: A page that loads smoothly on desktop may lag on mobile due to lower processing power, less memory, or a smaller screen size.
-
Network stability varies: Mobile users often rely on slower or inconsistent connections (e.g., 3G or congested 4G), which can expose performance issues that aren’t visible on fast broadband.
Takeaway: Run separate speed tests for mobile and desktop. This helps you identify device-specific issues and ensures a fast, consistent experience for all users, regardless of how they access your store.
Test a representative set of page types
Every page type — from product listings to checkout — has its own layout, functionality, and performance profile. Testing only a single page can give you a false sense of confidence.
Rather than testing every URL individually, focus on a small set of representative page types that reflect the different templates and user flows in your store. This gives you a comprehensive view of performance without unnecessary repetition.
Here are the key page types to include in your speed test plan:
-
Homepage – Often media-heavy, with banners and carousels that affect LCP and CLS.
-
Category page (PLP) – Includes filters, layered navigation, and AJAX-loaded product grids — prone to JavaScript and INP issues.
-
Configurable product page – Contains complex variant logic and dynamic content blocks.
-
Simple product page – Provides a clean baseline for performance comparison.
-
Bundle product page – Can introduce load delays due to pricing calculations and block rendering.
-
Shopping cart – Includes real-time totals, shipping calculators, and potential third-party scripts.
-
Checkout (OnePage) – The most sensitive page for conversions. Any lag here directly impacts revenue.
-
CMS pages – Include About Us, FAQs, landing pages, or blog posts. Typically lighter, but often overlooked.
-
Customer account pages – Contain personalised data and dynamic blocks, especially when logged in.
Testing across these page types helps uncover performance issues that may only affect part of your site, especially on high-traffic or conversion-critical journeys.
Magento speed test: A crucial step for site health
Speed testing isn’t just a technical exercise — it’s essential for maintaining a healthy, high-performing Magento store. Performance issues don’t always surface visibly, but they can quietly erode user experience, search visibility, and revenue. A structured speed test helps you identify and resolve these problems before they impact your bottom line.
Here’s what a well-executed Magento speed test allows you to do:
-
Spot hidden bottlenecks: Large images, unoptimised scripts, or slow modules can quietly slow down your store. Speed tests help pinpoint the causes.
-
Catch UX problems: Layout shifts, delayed clicks, or input lag may frustrate users without triggering errors. Core Web Vitals reveal these hidden issues.
-
Validate technical changes: If you’ve just updated your theme, installed new modules, or deployed changes to infrastructure, a speed test verifies whether performance improved or declined. Testing before and after key changes is essential for preventing regressions.
-
Prepare for traffic spikes: If your site isn’t optimised ahead of time, load spikes can slow down the entire store or trigger timeouts. Proactive testing helps ensure your store can handle demand when it matters most.
-
Protect SEO and conversions: Slow sites rank lower and convert less. Studies show even a 1-second delay can reduce conversions by up to 7%, and Google’s ranking algorithm now considers site speed as a ranking factor.
Top 10 best loading test tools for Magento (free & paid)
Once you understand what to measure, the next step is choosing the right tools to run your speed tests. Not all performance tools are built the same — some focus on technical diagnostics, while others measure real-world experience or track performance over time.
This section covers 10 of the most effective tools for testing Magento site speed, including both free and paid options. Whether you're looking for a quick snapshot or ongoing performance monitoring, this list will help you choose the right tool for your workflow, team, and business goals.
Google PageSpeed Insights - Free
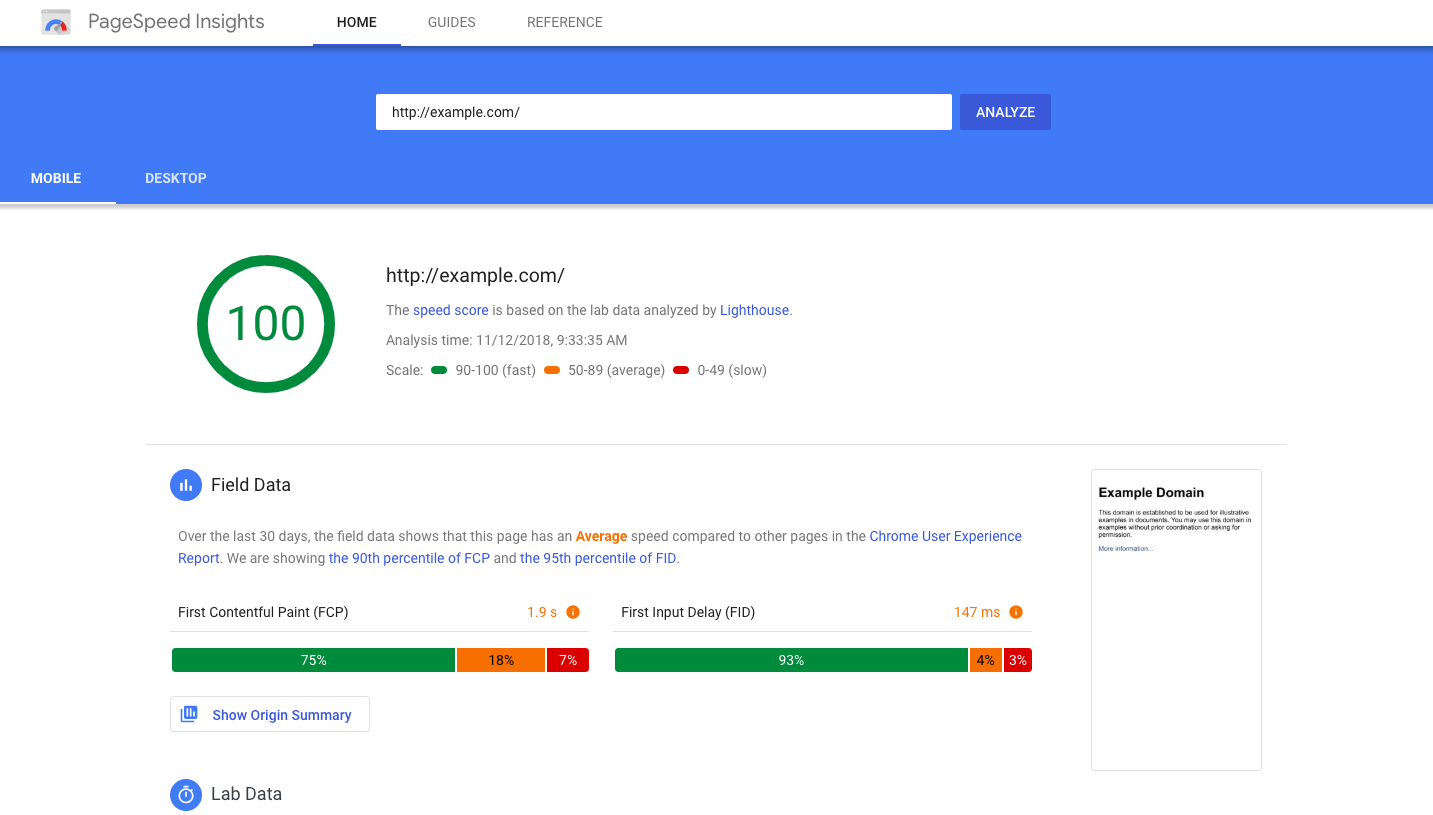
Overview: Google PageSpeed Insights (PSI) analyses your site’s performance using a combination of real-world data from Chrome users (field test) and a synthetic Lighthouse audit (lab test). It focuses heavily on Core Web Vitals, offering clear scores and actionable recommendations. For Magento stores, PSI is a quick, accessible way to assess how your site performs across mobile and desktop — and how it’s viewed by Google.
Type of test: Lab and Field (combined)
Key features:
-
Core Web Vitals + CrUX data: Combines real-user data (field) with Lighthouse test results (lab) to identify performance issues as experienced by actual Magento visitors.
-
Mobile and desktop modes: Runs separate tests for mobile and desktop users, simulating real devices and network conditions — helping you identify platform-specific issues.
-
Actionable performance diagnostics: Highlights concrete speed bottlenecks such as slow server response, unoptimised images, render-blocking scripts, or unused JavaScript — with clear guidance on what to fix.
-
Lighthouse audit integration: Includes built-in scores and recommendations across performance, SEO, accessibility, and frontend best practices — useful for technical and non-technical teams alike.
-
Simple KPI reporting: Presents colour-coded scores aligned with Google’s performance thresholds — making it easier to communicate results to stakeholders or track improvements over time.
Key metrics: LCP, INP, CLS (Core Web Vitals), FCP, TTFB, TBT
Price: Completely free. No login or installation required.
Ease of use: PSI is simple to use — paste in your URL and receive a detailed report in seconds. The interface is beginner-friendly, but interpreting and fixing technical issues may still require developer support.
Recommended for:
-
Merchants aiming to meet Core Web Vitals for SEO
-
SEO teams that monitor technical performance without advanced tooling
-
Businesses needing field-based speed KPIs for leadership reporting
How to use: Go to https://pagespeed.web.dev/, enter your Magento store URL, and run the test. Review both mobile and desktop tabs to see your Core Web Vitals scores and optimisation opportunities.
GTmetrix - Free & paid
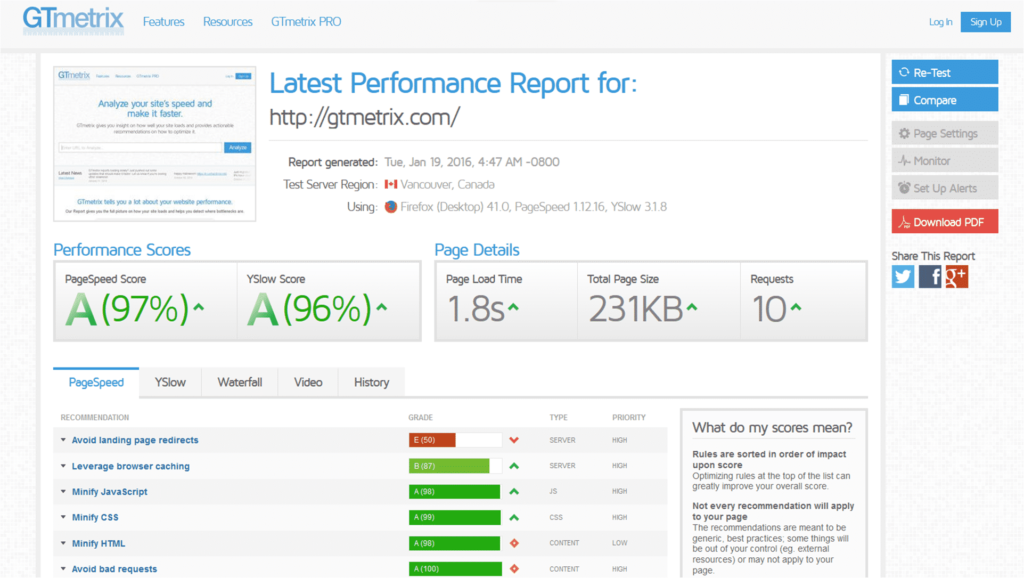
Overview: GTmetrix is a developer-focused performance testing tool powered entirely by Google Lighthouse. Since 2020, it has replaced its legacy PageSpeed/YSlow engine and now uses Lighthouse for all core scoring, while layering custom structure and diagnostic insights on top. It provides a detailed breakdown of how your Magento store loads — from critical rendering paths to asset-level bottlenecks — making it especially useful for technical teams tackling load order, script behaviour, and frontend delays.
Type of speed test supported: Lab only (field data viewable via CrUX integration on Pro plans
Key features:
-
Waterfall chart: Shows how each file loads and which assets block rendering — useful for spotting slow Magento scripts, large images, or third-party extensions that delay page load.
-
Structure tab: Flags unminified CSS/JavaScript, large DOM structures, and render-blocking elements — common in Luma-based or heavily customised Magento themes.
-
Filmstrip and video playback: Visualise when key content appears during load — ideal for reviewing image placement, layout sequencing, or theme optimisations.
-
Device and location testing (Pro): Simulate different devices and global regions to uncover mobile-specific or international performance issues.
-
Scheduled tests and alerts (Pro): Monitor speed trends over time and receive alerts if performance drops — useful for detecting regressions after code, app, or theme changes.
Key metrics:
-
LCP, CLS, FCP (Core Web Vitals), Speed Index, TBT
-
Structure Score (custom Lighthouse-based score reflecting frontend performance best practices)
Pricing:
-
Free: 5 tests/month
-
Individual: $5–$85/month (Micro, Starter, Growth, Champion)
-
Business: from $225/month
Ease of use: GTmetrix offers a clean interface with basic insights for beginners, but the full potential (e.g., interpreting waterfall charts or JavaScript blocking) is best unlocked by users with technical knowledge or developer support.
Recommended for:
-
Developers troubleshooting slow Magento themes or templates
-
Technical teams validating extension, script, or CDN performance
-
Agencies running comparative speed tests across storefronts
How to use: Go to https://gtmetrix.com, enter your Magento store URL, and click “Test your site.” Review the summary scores, performance, and structure tabs, and the waterfall chart to identify bottlenecks.
Pingdom Website Speed Test - Free & paid
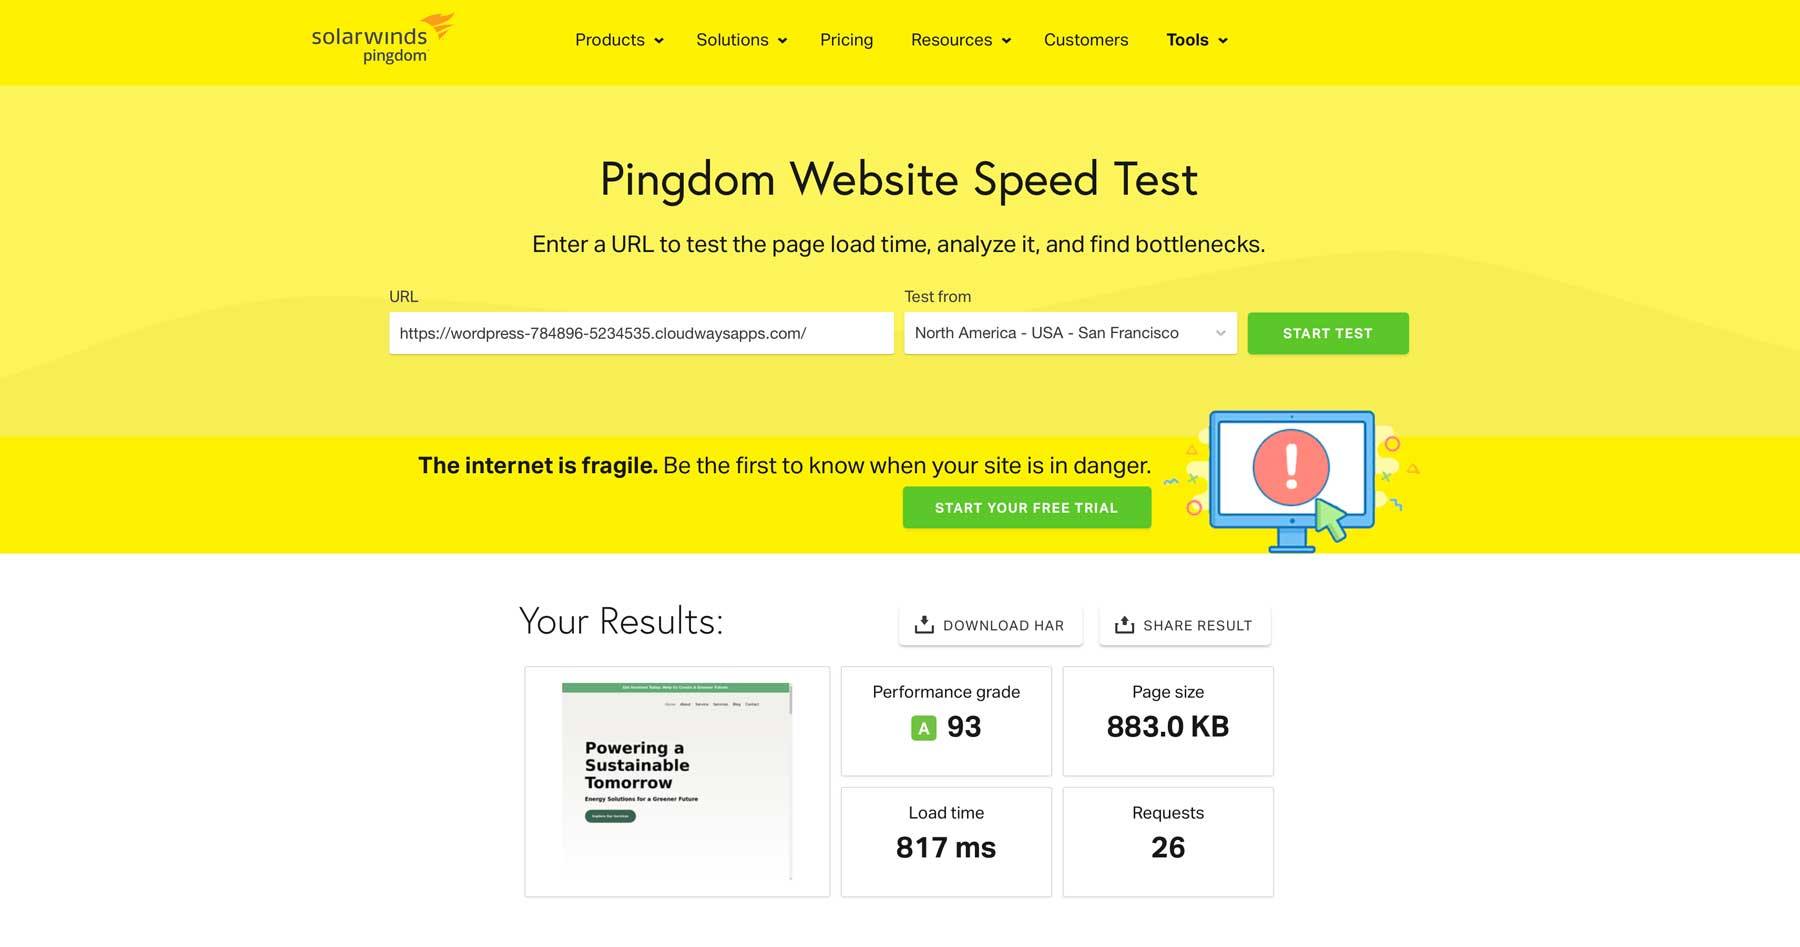
Overview: Pingdom is a lightweight website performance tool that’s ideal for quickly checking load times and monitoring speed over time. While it doesn’t track Core Web Vitals in detail, it’s well-suited for Magento merchants who want simple visual diagnostics, uptime alerts, and basic asset analysis.
Type of speed test supported: Lab only
Key features:
-
Performance summary includes load time, page size, and request count at a glance
-
Waterfall chart shows each asset’s load order and how long it takes to render — ideal for debugging slow scripts, fonts, or images
-
File type and domain breakdowns let you see how much content comes from third-party services (e.g., fonts, scripts, analytics)
-
Colour-coded state indicators show stages like DNS, SSL handshake, and server wait time for each asset
-
Simplified performance tips (e.g., “Compress components with Gzip,” “Reduce DNS lookups”) provide high-level optimisation suggestions
-
Content type analysis displays what proportion of the page is images, fonts, scripts, or HTML — helpful for spotting frontend bloat
Key metrics:
-
Load time: Total time from the first request to full page load.
-
Page size: Combined file weight of images, scripts, and assets.
-
Number of requests: How many HTTP requests your page makes.
-
Waterfall chart: Breaks down asset-by-asset loading timeline.
Pricing:
-
Free: Single-location test
-
Pro plans: from ~$15/month
-
Advanced plans: Custom pricing (with RUM, API access, monitoring integrations)
Ease of use: Extremely beginner-friendly — ideal for merchants who want quick insights without technical expertise. Waterfall charts are simple to interpret, and reports are visually structured.
Recommended for:
-
Store owners tracking frontend health over time
-
Marketing teams preparing for sales events or promotions
-
Agencies running high-level speed checks for client sites
How to use: Visit https://tools.pingdom.com, enter your Magento store URL, choose a test location (if available), and click “Start Test.” Review load time, asset sizes, and request count in the results.
Webpage Test - Free & paid
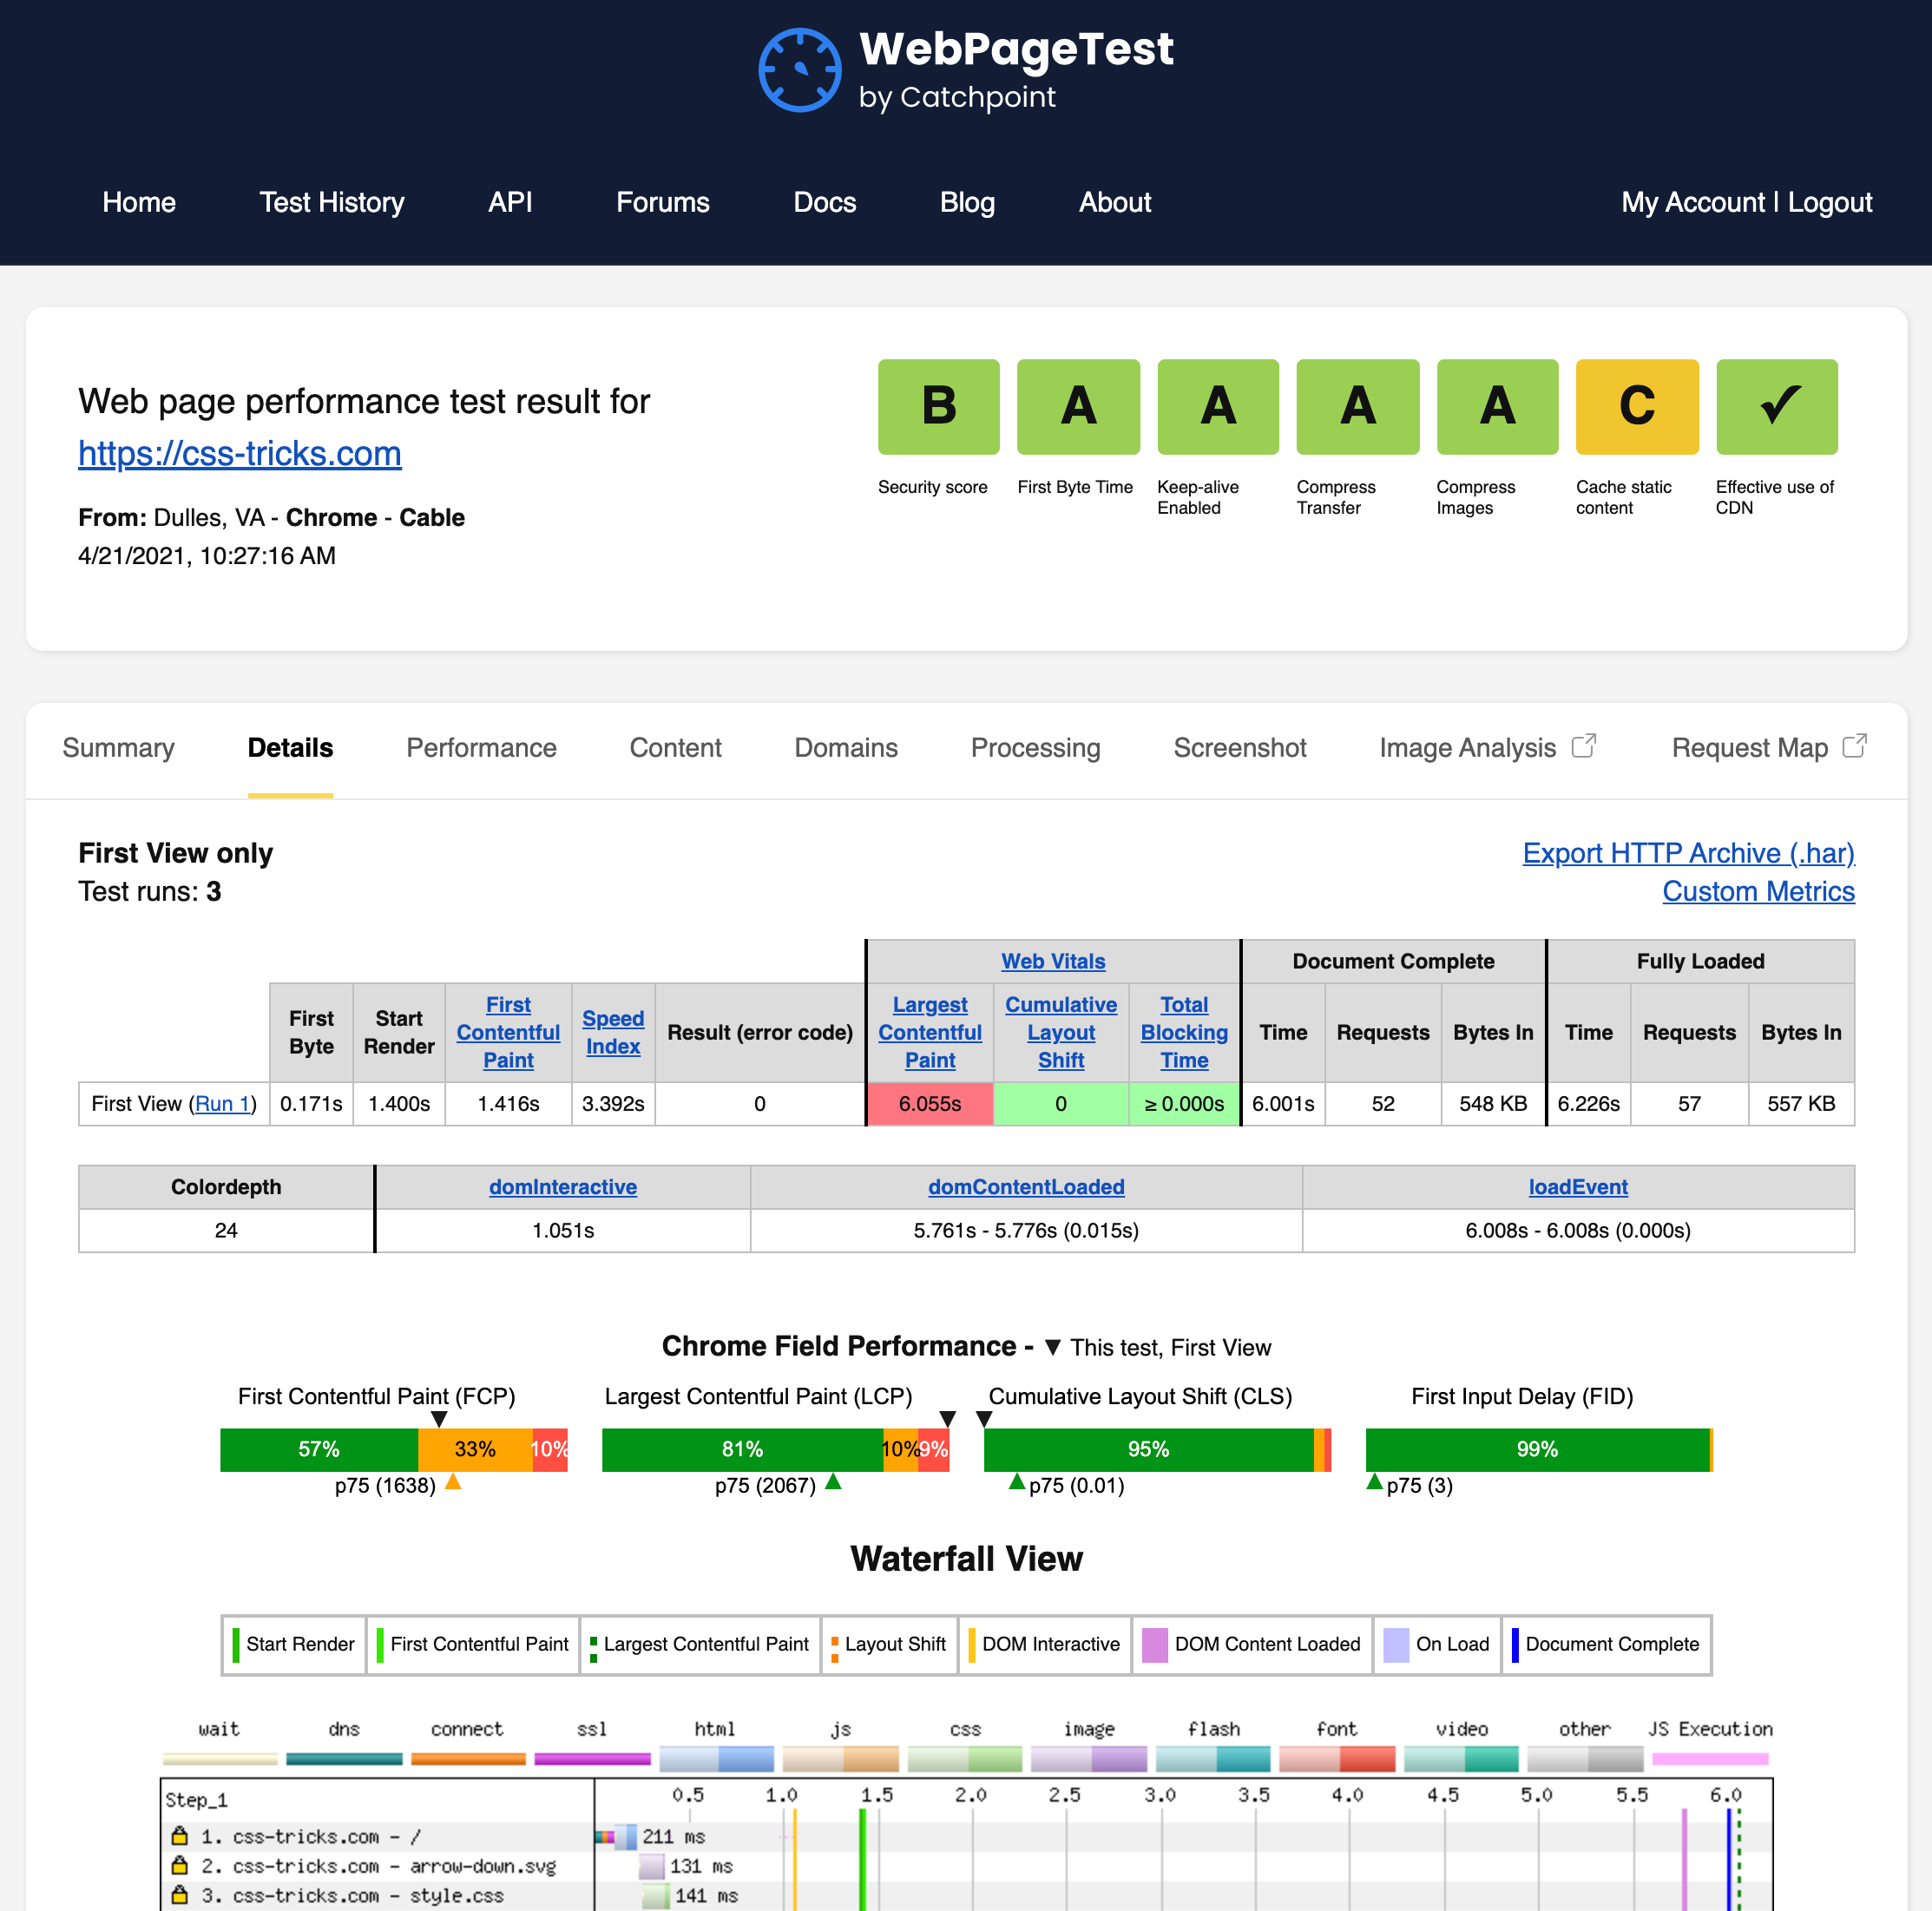
Overview: WebPageTest is a highly configurable speed testing tool designed for technical users who require in-depth visibility into how a Magento store performs across various devices, networks, and locations. It offers advanced features like filmstrip comparisons, request-level breakdowns, cache analysis, and network throttling — ideal for diagnosing inconsistent or region-specific performance issues.
Type of speed test supported: Lab only. CrUX field data may be displayed for supported URLs, but it isn’t used in scoring or test logic.
Key features:
-
Global location testing + connection throttling: Run tests from different countries and simulate slow network speeds (like 3G) to identify regional performance issues or problems with your CDN setup.
-
Device testing + first vs repeat view comparison: Run tests using real desktop or mobile browsers (not emulated) and compare first-time loads against repeat visits to assess how effectively Magento’s full-page cache or Varnish delivers cached content.
-
Waterfall chart + filmstrip and video capture: See exactly when each element of your page loads — including scripts, images, and fonts — and use visual tools to spot delays or layout shifts that affect the user experience.
Key metrics:
-
LCP, INP, CLS, FCP (Core Web Vitals), TTFB
-
Waterfall Chart: Visual breakdown of asset loading to identify bottlenecks.
-
Filmstrip & Video Capture: Visual representation of page load and key elements appearing.
Pricing:
-
Free: 150 monthly runs from 30 locations
-
Pro: from $15/month
-
Expert: $999/month
Ease of use: WebPageTest is not beginner-oriented. While basic testing is straightforward, interpreting results, especially waterfall charts and cache behavior, typically requires technical understanding.
Recommended for:
-
Technical store owners with dev experience
-
Merchants working with a Magento agency or performance partner
How to use: Go to webpagetest.org, paste your Magento store URL into the search bar, choose a test location and device (optional), then click “Start Test”. Results are generated in a few minutes with detailed diagnostics
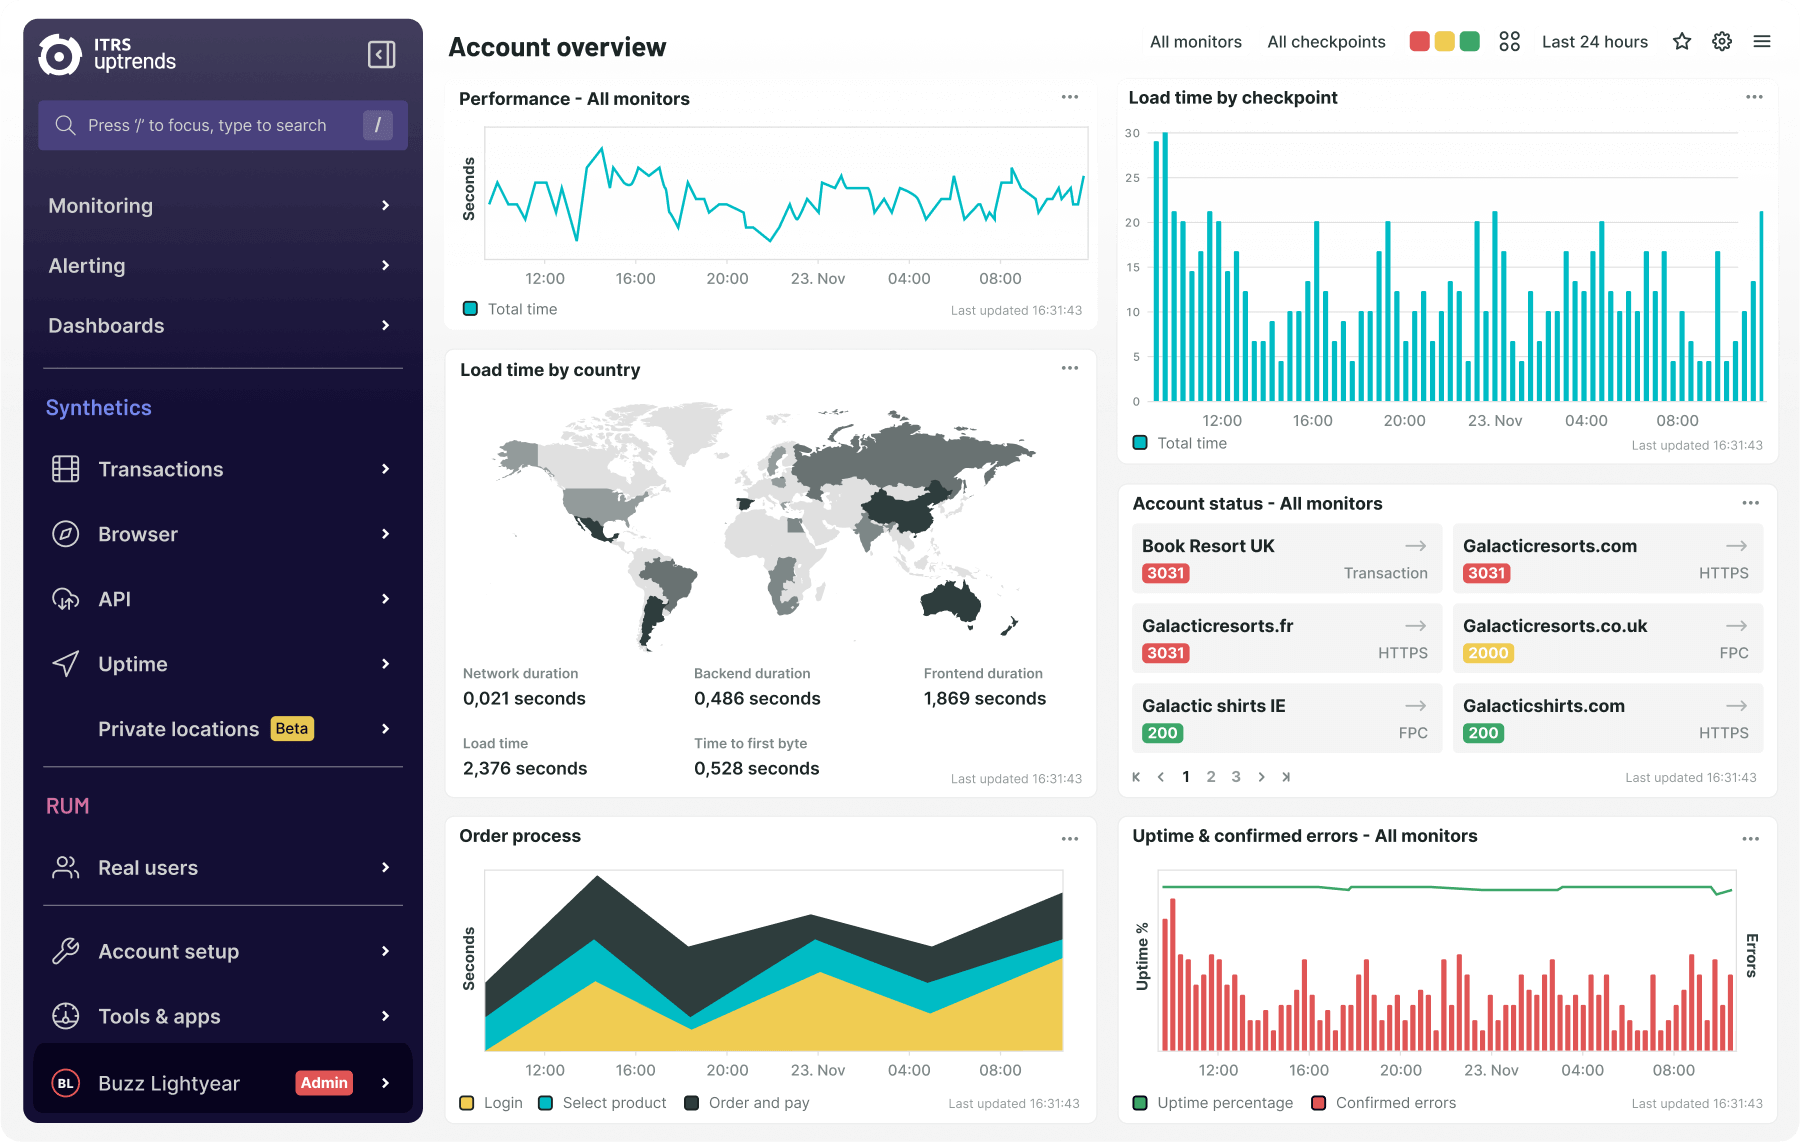
Uptrends - Free & paid
Overview: Uptrends gives Magento merchants deep insight into site performance across regions, devices, and networks, making it an excellent choice for diagnosing international UX issues and CDN effectiveness.
Type of speed test supported: Lab (with optional field data on paid plans)
Key features:
-
Global location testing: Test your Magento store’s speed from over 10 global locations on the free plan, or up to 233+ on paid plans — useful for finding slow load times in specific regions or international storefronts.
-
Device and browser emulation: Check how your site performs on different browsers like Chrome and Edge, and simulate mobile viewports with various network speeds — helpful for identifying issues that only affect mobile or slower connections.
-
Waterfall chart and content breakdown: Analyse which files (scripts, images, fonts) slow down your site and spot blocked resources or oversized assets — great for debugging theme bloat or extension impact.
-
Uptime monitoring and alerts: Get basic downtime alerts via email on the free plan, or access advanced monitoring features like detailed dashboards, real user monitoring (RUM), error snapshots, and integrations with tools like Slack or PagerDuty on paid plans.
Key metrics: LCP, CLS, FCP (Core Web Vitals), TTFB, Speed Index, TBT
Pricing:
-
Free: Unlimited manual tests from 10 locations
-
Starter: from $15/month
-
Professional: from $28/month
-
Business: from $48/month
-
Enterprise: Custom
A 30-day free trial is available across all plans — no credit card required. It includes the full monitoring suite: uptime checks, alerting, detailed dashboards, and performance insights.
Ease of use: Uptrends is user-friendly for basic speed checks, but interpreting waterfall charts, regional variations, or RUM data may require technical experience, especially when evaluating CDN, cache headers, or third-party scripts.
Recommended for:
-
Store owners with technical knowledge or developer support
-
Merchants working with an agency that handles international performance monitoring or uptime strategy
How to use: Visit uptrends.com/tools/web-page-speed-test, enter your Magento store URL, optionally set location/device, and click “Start Test”. You’ll get a waterfall layout, Core Web Vitals metrics, and performance suggestions.
Dotcom-Tools (Dotcom-Monitor) - Free & paid
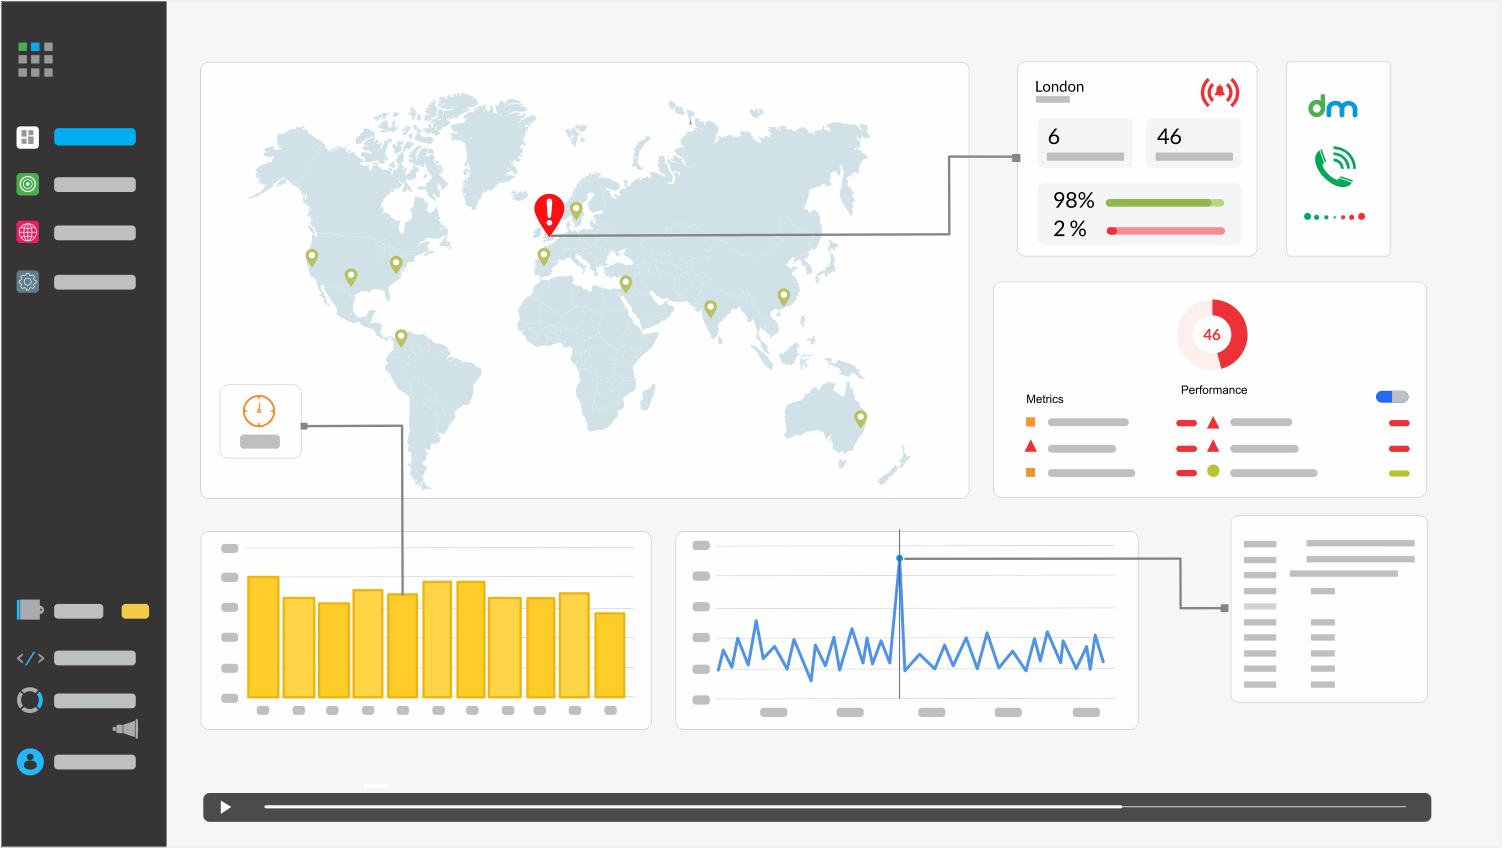
Overview: Dotcom‑Tools helps Magento merchants monitor and troubleshoot site performance across key storefront flows — from product discovery to checkout. It runs page load and transaction tests from multiple global locations and browser types, helping you identify where delays happen and what’s causing them.
Type of speed test supported: Lab (with optional field data on paid plans)
Key features:
-
Test from real browsers and global locations: Run speed tests from over 25 worldwide locations using real browsers like Chrome, Firefox, iOS, and Android. This helps you identify if your Magento store loads slower in certain regions or on specific devices.
-
Simulate full customer journeys: Test complete storefront flows — like homepage → product → cart → checkout — to catch performance issues during actual shopping behavior. Useful for validating new themes or monitoring checkout reliability.
-
Visual load breakdown with video and element timing: See exactly how long each part of your page takes to load using a detailed Waterfall chart, filmstrip video, and DOM timing metrics. Great for spotting large images, slow scripts, or blocked assets.
-
Built-in Lighthouse audit for SEO and UX checks: Get automatic Google Lighthouse scores for performance, accessibility, SEO, and best practices — ideal for keeping your store technically sound and search-friendly.
-
24/7 monitoring with alerts (paid plans): Set up automatic checks and receive alerts via email, SMS, or Slack if pages slow down or break. Useful for campaigns, launches, or ensuring checkout stays fast.
-
Test desktop vs mobile performance: Emulate different devices and browsers to uncover speed issues unique to mobile users — like delayed interactivity or layout glitches on smaller screens.
Key metrics:
-
LCP, INP, CLS, TTFB, FCP
-
Waterfall Chart: Pinpoints render-blocking assets or slow-loading extensions
-
Filmstrip & Video Capture: Shows exactly when key content appears during the load experience
Pricing:
-
Free: Basic speed test from up to 3 locations
-
Page Performance Monitoring: from $29.96/month
-
Web Application Monitoring: from $38.95/month
A 30-day free trial is available for all paid plans — no credit card required. It includes the full monitoring suite with uptime checks, alerting capabilities, detailed dashboards, and performance insights.
Ease of use: Dotcom‑Tools is beginner-friendly for basic page tests, but transaction scripting and interpreting full waterfall reports are better handled by technical users or agencies.
Recommended for:
-
Technical teams managing Magento infrastructure or frontend performance
-
Merchants with complex user journeys that need proactive validation and monitoring
How to use: Go to https://www.dotcom-tools.com/website-speed-test.aspx, enter your Magento store URL, select up to 3 test locations and a browser (Chrome by default), then click “Start Test”. Paid users can configure scripted flows and ongoing monitoring through the Dotcom‑Monitor dashboard.
Yellow Lab Tools – Free
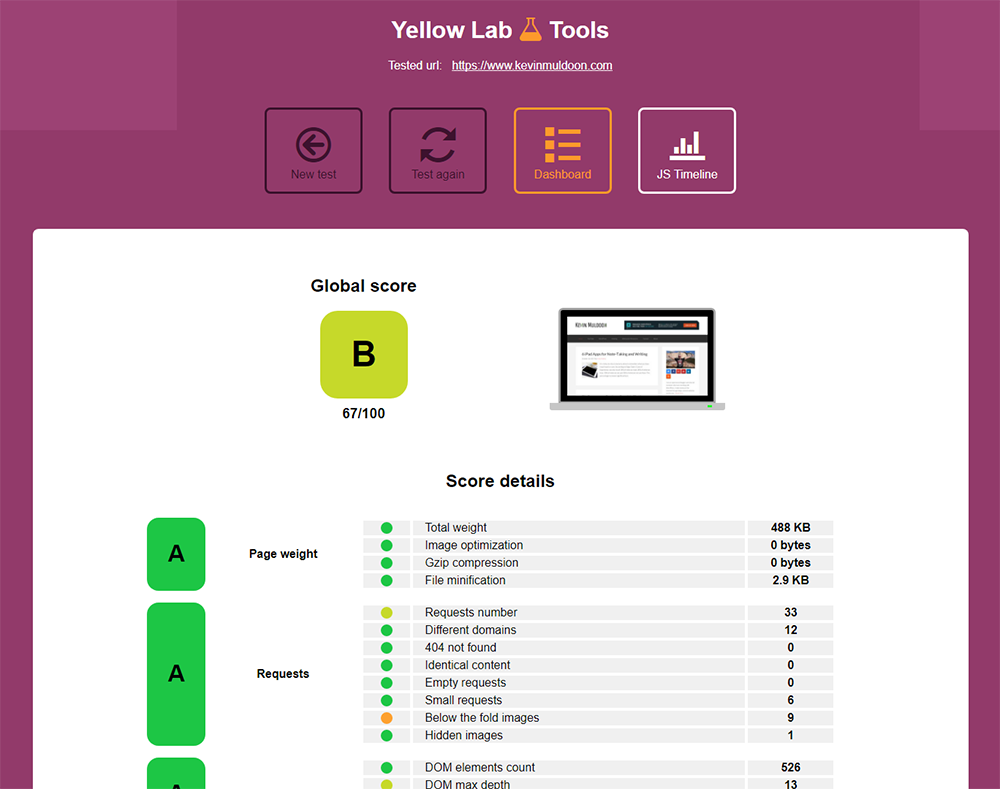
Overview: Yellow Lab Tools is a free, developer-focused tool designed to analyse frontend code quality and detect bottlenecks that hurt page speed. It’s particularly valuable for Magento merchants dealing with heavy themes, complex JavaScript, or layout instability, offering deep technical insights not often covered by mainstream tools.
Type of speed test supported: Lab only
Key features:
-
JavaScript and CSS complexity analysis: Identifies oversized JavaScript files, poorly structured code, and inefficient CSS — useful for spotting issues in heavy Magento themes or extensions that cause blocking or slow rendering.
-
DOM size and depth reporting: Measures how many elements are loaded on a page and how deeply they’re nested — helpful for detecting bloated product or category pages built with page builders or widgets.
-
JavaScript timeline: Visualizes when scripts execute during page load and flags long tasks that delay interactivity — ideal for debugging slow cart, checkout, or product customizer features.
-
Bad practices detector: Flags technical inefficiencies like duplicated CSS selectors, inline styles, deeply nested HTML, or synchronous scripts — which can slow page speed and impact layout stability.
Key metrics:
-
JavaScript parse and execution time – how long scripts take to process
-
DOM complexity – number of nodes and nesting depth
-
Style recalculations – triggered when layout updates cause reflows
-
Number of HTTP requests – scripts, images, fonts, etc.
-
Page weight – total size of all frontend resources
-
Global performance score – based on frontend best practices
Pricing: Free (open-source tool)
Ease of use: The interface is straightforward but technical. Designed more for developers than general business users, though performance issues are clearly labelled with explanations.
Recommended for:
-
Developers working on Magento theme or module optimisation
-
Agencies performing frontend audits during replatform or rebuild projects
-
Merchants using heavily customised or third-party Magento themes
How to use: Go to https://yellowlab.tools, enter your Magento store URL, and run the test. Review flagged issues by category and use the score breakdown to identify areas for frontend code clean-up or refactoring.
SpeedVitals – Free & paid
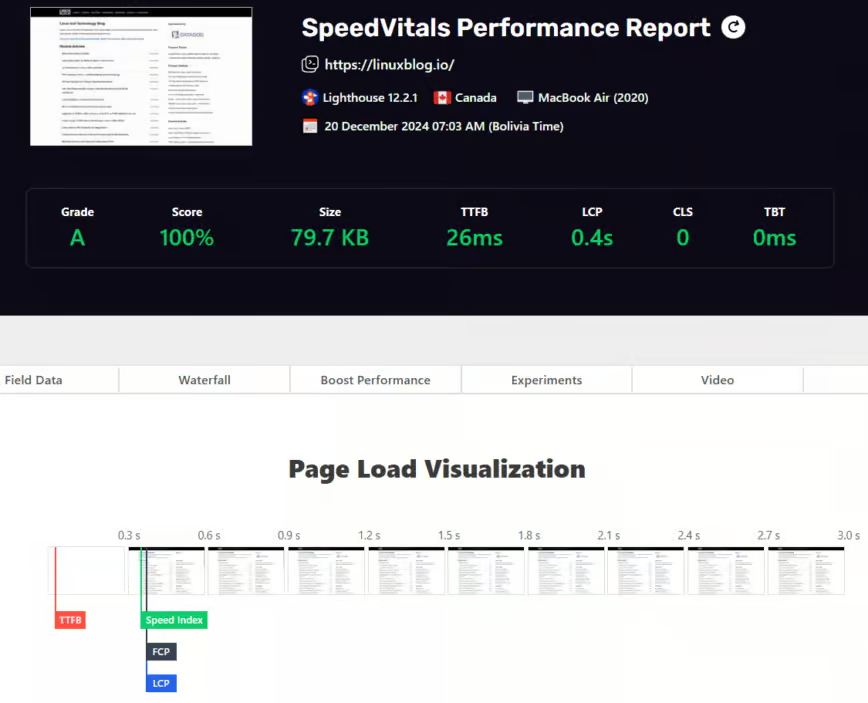
Overview: SpeedVitals is a performance testing tool that focuses on Core Web Vitals, responsive speed metrics, and device-specific diagnostics. It allows merchants to test across multiple device types and connection speeds simultaneously, making it especially helpful for identifying mobile performance gaps in Magento stores.
Type of speed test supported: Lab and Field (CrUX data available)
Key features:
-
Multi-device and network simulation: Test how your Magento store performs on entry-level smartphones, tablets, or slow 3G networks — ideal for uncovering speed issues that only affect real-world users on lower-end devices.
-
Visual comparison tool: Compare performance side-by-side across different devices or between staging and live environments — useful for spotting regressions before deploying theme or extension updates.
-
Performance breakdown by element: Identify which parts of the page — like product images, review blocks, or recommendation sliders — are taking the longest to load and impacting overall performance.
-
Code diagnostics tab: Detects render-blocking CSS, unused JavaScript, and layout shifts — helping you clean up theme code and improve Core Web Vitals scores.
-
Responsive loading audit: Tracks how your site loads across various screen sizes and breakpoints — a unique feature for ensuring your Magento store performs well on all devices, not just desktop or mobile alone.
Key metrics:
-
LCP, CLS, INP, FID, TTFB
-
Fully Loaded Time & DOM Load Time – page readiness
-
Responsiveness Score – weighted average of load speed across screen sizes
Pricing:
-
Free: Full-featured manual tests
-
Paid: From $7/month (includes bulk tests, monitoring, API access)
Ease of use: Very user-friendly interface with simple test setup and clearly explained metrics. Suitable for both non-technical users and developers. Advanced diagnostics are optional but available.
Recommended for:
-
Teams managing responsive themes or multi-device storefronts
-
Agencies conducting frontend audits or replatform assessments
How to use: Go to https://speedvitals.com, enter your Magento store URL, and select device/network profiles to begin testing. Review field data (if available), lab metrics, and responsive layout performance across breakpoints.
Site24x7 – Free & Paid
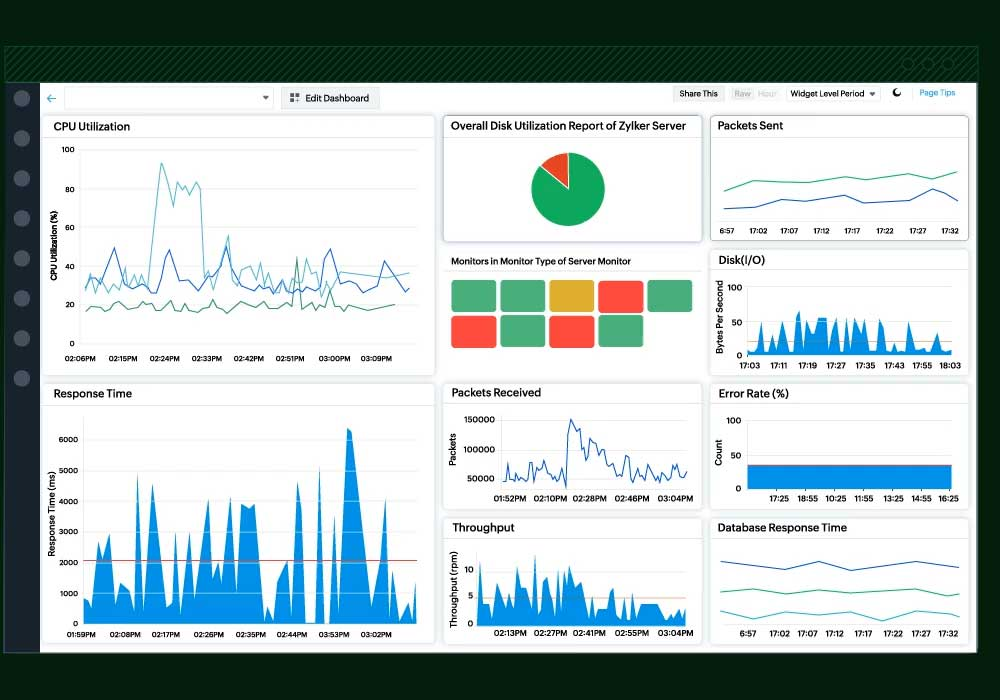
Overview: Site24x7 is an enterprise-grade performance and uptime monitoring platform. It allows Magento merchants to simulate user journeys, monitor site health from over 100 global locations, and correlate frontend performance with backend infrastructure — making it ideal for stores with international audiences or complex hosting setups.
Type of speed test supported: Lab and Field (field data via Real User Monitoring)
Key features:
-
Synthetic transaction monitoring: Simulate complete user journeys — such as homepage → product → cart → checkout — to test speed and functionality across each step of the shopping experience.
-
110+ global testing locations: Detect latency, CDN misrouting, or slow responses by testing how your Magento store performs in different regions around the world.
-
Real user monitoring (RUM): Collect performance data directly from real Magento visitors, including Core Web Vitals like LCP, INP, and CLS — providing insight into actual user experience.
-
Waterfall and resource timing analysis: Break down how each file loads, identify bottlenecks in load order, and pinpoint slow third-party scripts or blocking assets.
-
Multi-device and browser simulation: Test your site across a range of browsers, operating systems, screen sizes, and network speeds — useful for spotting mobile-specific or browser-related slowdowns.
-
AI-based anomaly detection: Automatically flag unusual slowdowns or performance changes based on historical trends — helping you catch issues before they impact customers.
-
Full-stack monitoring integration: Combine frontend testing with backend insights such as server uptime, CPU usage, application errors, and network availability — ideal for diagnosing performance holistically.
Key metrics:
-
LCP, CLS, FCP (Core Web Vitals), TTFB
-
Synthetic response time and uptime % – across regions and test points
-
DOM load time, waterfall breakdown, and asset-level timings
Pricing:
-
Free: 1 website monitor, 5-min interval checks
-
Paid:
-
Website Monitoring: from $10/month
-
RUM: from $10/month
-
Full suite (APM, infra, logs): from $35/month
-
Ease of use: Moderately technical. Dashboards are intuitive, but configuring multi-step flows or interpreting full-stack data may require developer involvement.
Recommended for:
-
Magento merchants with international audiences
-
Stores preparing for high-traffic campaigns or peak sales
-
DevOps or IT teams managing Magento hosting and infrastructure
-
Agencies offering managed Magento performance services
How to use: Go to https://www.site24x7.com, sign up for a free account, and add your Magento store URL. Set up synthetic tests, enable RUM for real-user metrics, and configure alerts or dashboards based on your performance goals.
Contentsquare (formerly Dareboost)
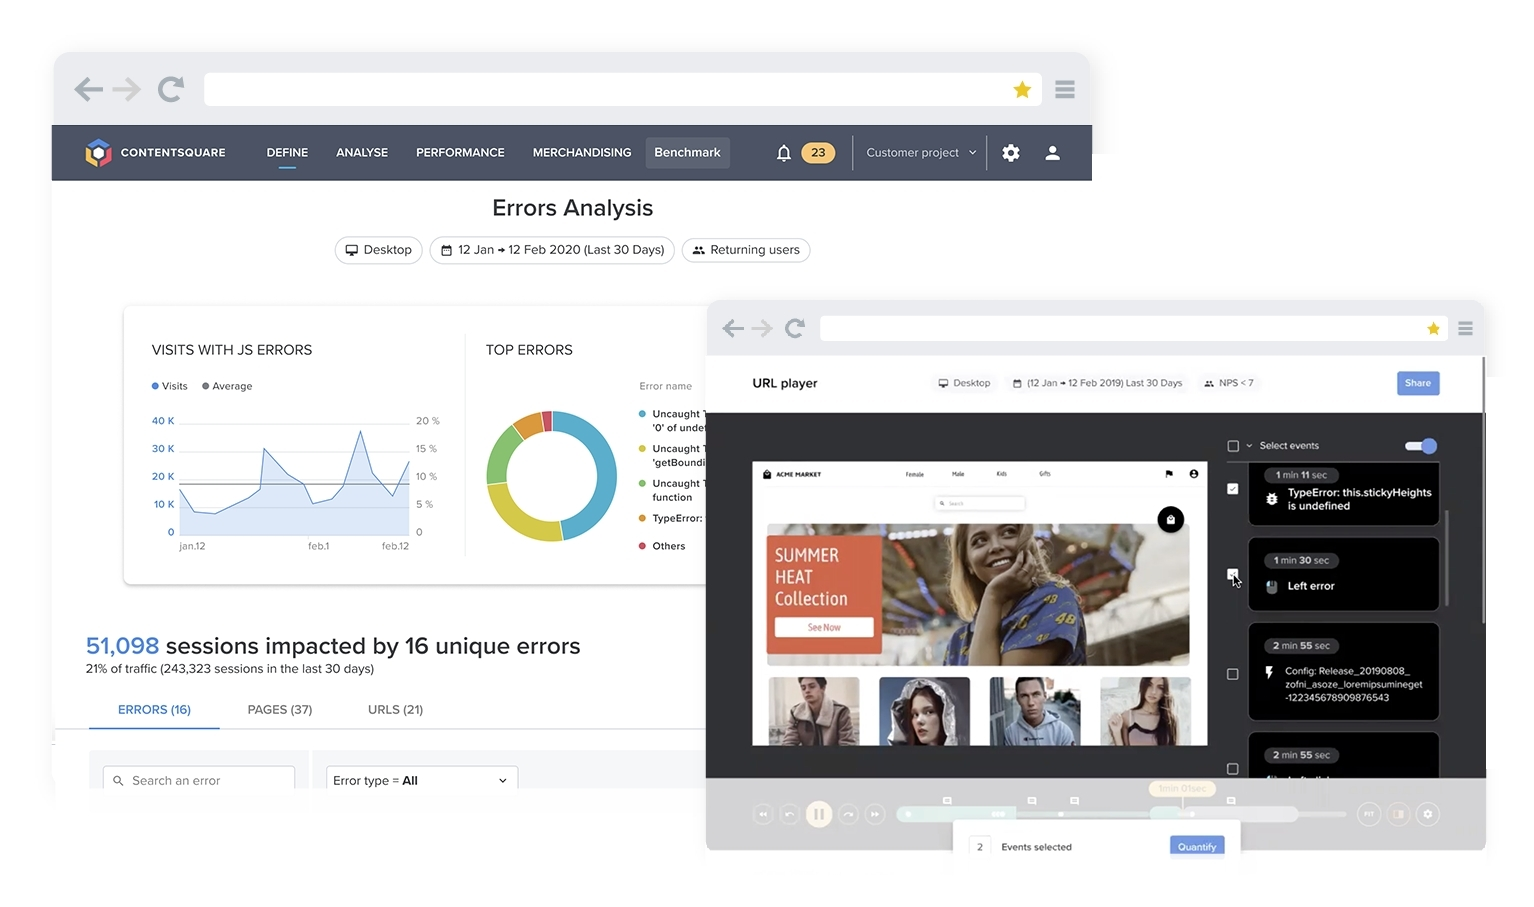
Introduction: Dareboost was previously a popular tool for page speed testing and frontend audits, offering detailed lab reports for Magento merchants. Since being acquired by Contentsquare, Dareboost has been integrated into an enterprise digital experience analytics platform. Contentsquare now focuses on real user behavior, journey analysis, and performance monitoring at scale — but does not offer a public speed testing tool.
Type of speed test supported:
-
Real-user monitoring (field only, enterprise environments)
-
No standalone lab testing for public use
Key features:
-
Real user monitoring (RUM): Capture Core Web Vitals from real Magento visitors in real time, providing live insight into how your store performs for actual users.
-
Journey and conversion analytics: Understand how page speed affects user behaviour, including drop-off rates, scroll depth, and goal completion across your key funnels.
-
Segmented performance insights: Filter speed data by country, device type, traffic source, or user behaviour — helping you pinpoint where performance issues are costing conversions.
-
Error tracking and performance alerts: Gain enterprise-level visibility into frontend errors, layout shifts, or slowdowns — with instant alerts to flag regressions before they affect customer experience.
Key metrics: LCP, INP, CLS, FCP, TTFB — via real user monitoring (Does not offer on-demand Lighthouse-style testing)
Pricing: Contentsquare is an enterprise platform with custom pricing. It is typically used by large retailers and brands managing high-volume storefronts.
Ease of use: For performance insights, Contentsquare is highly advanced but only suited to teams with in-house analytics or eCommerce optimisation resources.
Recommended for:
-
Digital teams needing Core Web Vitals tracking at scale (field data, not synthetic)
-
Brands optimizing across multiple regions, storefronts, or devices
-
Teams with in-house developers or CRO specialists
How to use: Contentsquare must be integrated into your Magento storefront as part of an enterprise deployment. It captures performance passively as users browse your site.
Key takeaways: Choosing the right Magento speed testing tool
Magento speed tools aren’t one-size-fits-all. Broadly speaking, they differ in:
-
How they measure performance: Some tools use field data (based on actual user behavior), while others rely on lab tests (simulated environments).
-
Who they’re designed for: Some are built for non-technical users or marketers, while others are geared toward developers or enterprise operations teams.
The table below helps you match each tool to your needs based on these two dimensions.
| Tool | Test type | Best suited for | Key strengths |
| Google PageSpeed Insights | Lab + Field (CrUX) | Non-technical & SEO teams | Clear Core Web Vitals, no setup, CrUX data + Lighthouse audit |
| GTmetrix | Lab only | Developers | Waterfall view, frontend bottlenecks, layout rendering issues |
| Pingdom | Lab only | Marketers & Store Owners | Fast, visual, highlights large assets or 3rd-party bloat |
| WebPageTest | Lab only (CrUX visible) | Developers & Agencies | Regional testing, cache validation, repeat view, mobile simulation |
| Uptrends | Lab + Field (Pro plans) | Tech & Ops teams | Mobile/region tests, real browser emulation, alerting + uptime |
| Dotcom-Tools | Lab (RUM on Pro) | Dev & QA teams | Simulated user journeys, DOM load timing, flow validation |
| Yellow Lab Tools | Lab only | Frontend Developers | DOM size, JS/CSS complexity, inline styles, blocking script detection |
| SpeedVitals | Lab + Field (CrUX) | Cross-functional teams (dev + non-dev) | Mobile/responsive audit, visual load maps, easy Core Web Vitals reporting |
| Site24x7 | Lab + Field (RUM) | Enterprise Operations | Full-stack monitoring, RUM + synthetic, alerting, global visibility |
| Contentsquare | Field only (RUM only) | Enterprise UX/CRO teams | Segment-level performance, funnel impact, and real-time user metrics |
The major drawback of Magento speed test tools: Lack of automation
Most speed testing tools are built for ad hoc analysis — useful for diagnostics, but insufficient for continuous performance monitoring. For Magento merchants, this creates a visibility gap: performance issues can go undetected between tests, especially when caused by third-party scripts, infrastructure changes, or seasonal traffic spikes.
-
Manual testing doesn’t scale: Manually testing key pages like the homepage, category, product, cart, and checkout can be time-consuming and inconsistent, particularly in development cycles or multi-store setups.
-
Performance changes constantly: Page speed can fluctuate depending on time of day, network congestion, cache status, or CDN behaviour. A single test doesn’t capture this variability.
-
Most tools lack historical context: Unless you’re on a high-tier plan with scheduling and reporting, most tools don’t retain test history — making it hard to track trends or prove that recent updates improved performance.
AuditIQ: Automated speed monitoring built for Magento
AuditIQ is an automated performance monitoring platform purpose-built for Magento merchants. It continuously tests key pages, detects regressions, and alerts your team when performance drops — all without requiring manual effort.
Key features:
-
Runs daily automated speed tests on your homepage, category, product, cart, and checkout pages using Google Lighthouse.
-
Visualises performance trends over time with historical charts showing changes in Core Web Vitals like LCP, CLS, and INP.
-
Sends real-time alerts via email or Slack when your site’s speed or Core Web Vitals exceed defined thresholds.
-
Installs easily using a lightweight PHP agent and optional JavaScript snippet, with no changes required to your Magento code or theme.
-
Generates prioritised reports that highlight frontend, server, SEO, and configuration issues affecting speed and stability.
If you need more than a single snapshot — and want full visibility over how your Magento store performs throughout the week — AuditIQ helps you monitor what matters, automatically.
Best practices to make your Magento store load faster
Magento’s flexibility means performance depends on how your store is hosted, built, and maintained. Here are five essential tactics to speed up your store:
-
Configure your server properly: Use Magento-optimised hosting with Redis, Varnish, and a server location close to your audience.
-
Switch to the Hyvä theme: Replace legacy frontend frameworks with lightweight alternatives like Alpine.js to reduce JavaScript bloat and improve Core Web Vitals.
-
Enable caching and use a CDN: Use Full Page Cache (or Varnish) and a CDN to deliver content faster across regions.
-
Optimise images and static assets: Convert images to WebP, enable lazy loading, and compress assets to reduce page weight.
-
Minify and defer JavaScript/CSS: Minify and defer non-essential JavaScript and CSS to prevent render-blocking resources and ensure faster page rendering.
How to do: -
Go to Stores -> Configurations -> Advanced -> Developer/li>
-
Under JavaScript Settings, Set the Minify JavaScript Files field to ‘Yes’.
-
Expand CSS Settings and set the Merge CSS Files and Minify CSS Files
-
fields to ‘Yes’. Click the Save Config button and clear the cache.
For a deeper look at server-level tactics like HTTP/2, Redis caching, and database maintenance, MGT Commerce's guide to Magento 2 speed optimisation covers the hosting side in more depth.
Conclusion
Testing your Magento store’s performance requires more than a quick tool run — it involves understanding what to measure, choosing the right tools, automating where possible, and following frontend best practices.
In this guide, we covered:
-
What Core Web Vitals and related metrics measure — and why they matter
-
How to choose between lab and field testing tools
-
A comparison of 10 top speed testing tools (free and paid) for Magento
-
The limitations of manual testing — and how AuditIQ automates performance monitoring
-
Five essential tactics to make your Magento store load faster, from server setup to frontend optimisation
At On Tap - A trusted Magento development agency, we help Magento merchants reduce page load times, improve Core Web Vitals, and create faster, conversion-focused storefronts. Beyond performance optimisation, we also deliver Hyvä development services, giving merchants a lightweight Magento frontend that achieves exceptional speed and scalability. Whether you need expert advice, theme optimisation, or fully managed speed monitoring, we’re here to help.
Want help speeding up your Magento site? Contact us today!